ZB Bonds Breakout: VWAP & SMA Breach Toward 161.8% Fib The recent price movement in ZB bonds presents a compelling bullish setup, backed by strong confluences. Here’s a precise breakdown of key technical factors driving this trade:
Bullish Breakout Confirmation
The price has successfully broken above the VWAP and the 209 SMA, signaling strong institutional momentum.
This break suggests a sustained bullish trend, as overcoming these key resistance levels often invites additional buying pressure.
Fibonacci Extension as a TP Target
Using Fibonacci extension analysis, we aim for the 161.8% level relative to the previous impulsive wave.
This level serves as an optimal target zone where price action tends to slow down, making it an ideal profit-taking area for traders.
Pullback & Confirmation of TP
A potential pullback to the 209 SMA would act as a critical test. If price retests this level and forms a strong green candle, it confirms sustained bullish strength and solidifies the TP target.
This reaction provides a reliable validation point before price reaches exhaustion at the Fib extension level.
Execution Plan:
Entry: Break above VWAP & SMA confirms bullish sentiment—ideal for initiating a long position.
Monitoring: Watch for a pullback above SMA to validate the rally.
TP Target: Set profit exit at 161.8% Fibonacci extension, aligned with wave analysis.
Risk Management : Tighten stop-loss levels if price fails to hold above SMA on a pullback.
Conclusion
This trade setup integrates multiple layers of technical validation, combining VWAP, SMA, and Fibonacci extensions to strengthen our bullish bias while offering precise entry and exit levels. A disciplined approach using this strategy helps minimize risk while maximizing potential profits.
Follow @GoldenZoneFX for more Valuable insights
ZBM2018 trade ideas

Major Short Signal: SMA209 Breakdown + Rising VolumeAn explosive trade setup is emerging, with price decisively breaking below the SMA209 alongside a surge in selling volume—a classic confirmation of bearish momentum. This move presents an optimal shorting opportunity for traders looking to capitalize on trend shifts!
Key Observations:
SMA209 Break: A significant trend reversal, flipping prior support into resistance Volume Surge: Confirming institutional selling pressure & momentum shift Momentum Indicators: RSI entering oversold territory, MACD bearish crossover
Trade Strategy & Risk Management:
Entry: Short below SMA209 after confirmation candle closes Target: Key support zone or Fibonacci level for precise exits. Stop Loss: Above SMA209 breakdown or previous resistance level. Risk-to-Reward: Optimize with proper position sizing & trailing stops.
Professional Insights:
Why This Setup Works?
SMA209 acts as a dynamic trend gauge, and a break below signals market weakness
Institutional traders often drive volume spikes during trend reversals
Confirmation tools such as VWAP, order flow, and liquidation levels reinforce decision-making
💬 Are you taking this trade? How do you refine your short setups? Let’s discuss!
Follow @GoldenZoneFX for more valuable insights.

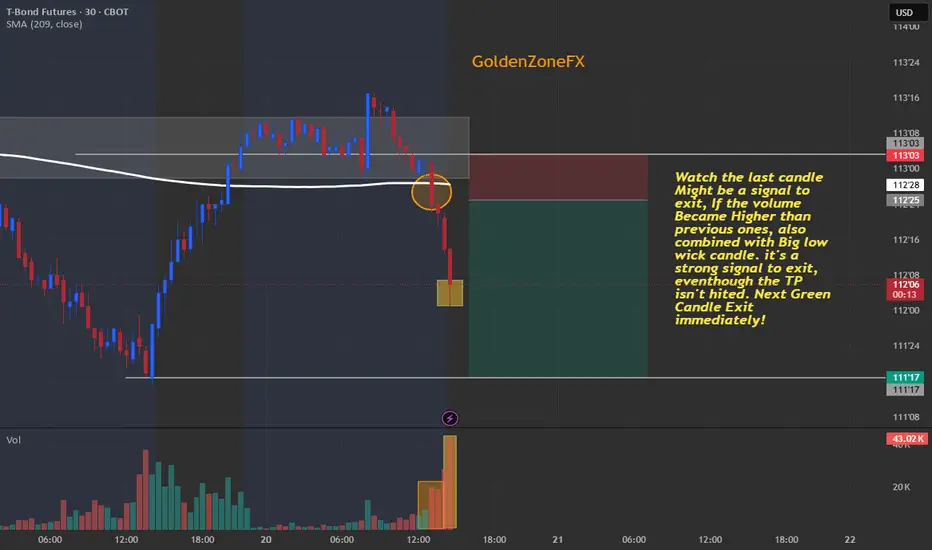
Warning watch this Out Might be the end of the moveFollow @GoldenZoneFX for more Valuable insights.
Are you catched that trade?
Divergence Since 2020 - What Happens When Bonds Continue?When Stocks & Bond Move Opposite Direction what does it mean?
We have observed a divergence between the stock and bond markets since 2020. While U.S. Treasury bonds entered a bear zone, the stock markets continued their upward climb. What are the implications of this decoupling?
Will the stock market resume its uptrend and hit new highs? Or is this merely a retracement before further downward pressure?
A healthy, three-way interdependent relationship occurs when the economy, bonds, and stocks move in the same direction. When investors have confidence in the U.S. economy, they tend to invest in long-term bonds, which it usually will benefits the stock market.
This alignment was evident between 2000 and 2020, during which bonds and stocks moved largely in tandem.
However, from 2020 onward, bonds began declining—signaling a loss of investor confidence in the economy. Technically, this should exert downward pressure on stocks as well.
Yet, we are witnessing a divergence: Where U.S. Treasury bonds have fallen while stocks have continued to rise.
When such a divergence surfaces, it signals the need for caution in our approach in the stock markets.
What could be the other reasons why US T-bond has peaked in 2020 and depreciated by 44% since then?
Micro E-mini Nasdaq Futures and Options
Ticker: MNQ
Minimum fluctuation:
0.25 index points = $0.50
Disclaimer:
• What presented here is not a recommendation, please consult your licensed broker.
• Our mission is to create lateral thinking skills for every investor and trader, knowing when to take a calculated risk with market uncertainty and a bolder risk when opportunity arises.
CME Real-time Market Data help identify trading set-ups in real-time and express my market views. If you have futures in your trading portfolio, you can check out on CME Group data plans available that suit your trading needs www.tradingview.com
Trading the Micro: www.cmegroup.com

$ZB - 30y Treasury Futures Sell off in Equity Risk OnThe 30-Year Treasury Bond Futures (ZB) sold off notably, driven by a combination of macro headlines and technical positioning. A key catalyst was the European Union’s decision to postpone the implementation of retaliatory auto tariffs until July 9th, which temporarily eased geopolitical tensions and triggered a risk-on rotation into equities — at the expense of duration-heavy fixed income assets.
From a technical standpoint, ZB fell sharply from the upper 3 standard deviation Bollinger Band and found support near the 2 standard deviation band, where it stabilized. It then retraced roughly 50% of the move, tagging the 20-period simple moving average. Market participants are now closely watching whether the contract completes a full measured move lower to 111'19, a level that represents:
The 100% Fibonacci extension of the prior decline
A test of the lower 3 standard deviation band
A notable inefficiency zone on the hourly chart
While the MOVE Index has declined and is now tracking sideways — signaling reduced bond market volatility — traders remain focused on long-end supply, fiscal slippage, and global rate re-alignments. Until these themes settle, technical levels like 111'19 may continue to act as magnets for price discovery in long-dated Treasuries.

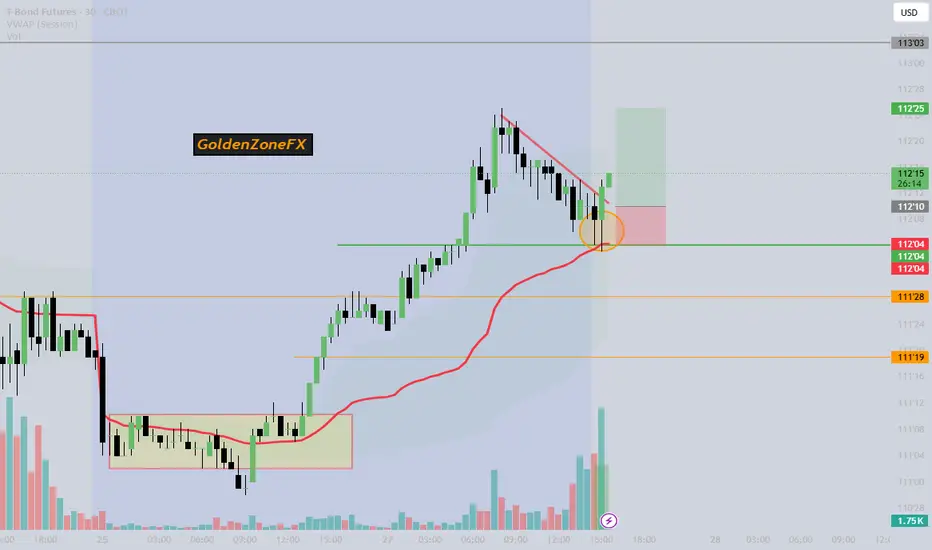
ZB1 Bullish trend Confirmation after a strong SignalThe price has successfully broken above previous resistance, confirming bullish strength. The breakout is supported by high volume, signaling institutional participation and strong momentum.
Key Technical Signals
Resistance Break: Price surpasses a critical level, flipping it into new support.
Volume Surge: Increased buying activity confirms commitment from large players.
VWAP Support: Price remains above VWAP, reinforcing trend continuation.
Momentum Strength: No immediate rejection at resistance, indicating sustained buying pressure.
Trade Strategy
Entry Zone: Pullback to newly confirmed support for a better risk-reward setup.
Stop Loss: Below previous resistance to protect against false breakouts.
Profit Targets:
First Target: Next resistance level above.
Second Target: Trend continuation zone with strong liquidity.
Final Target: Extended move if volume remains elevated.
Risk Management
Risk-to-Reward Ratio: Maintain a minimum 1:2 to optimize gains.
Trade Management: Adjust stop-loss dynamically as price moves higher.
Follow @GoldenZoneFX more content and Valuable Insights.
T Bond Futures Quarterly chart targets the LOWSDebt levels are increasing
There is insufficient demand to soak issuance.
Interest rates need to increase.
The value of bonds is expected to decline down to the bear flag target.

Technical Collapse: ‘Strong Sell’ Signal Flashes Technical ratings turned Strong Sell as open interest dropped to 1.80M contracts this week
signalling bearish momentum.
Hedge funds unwound basis trades, triggering forced selling and margin calls.

ZB1! - April ReviewDuring times of consolidation, it's best to keep your powder dry. Don't shoot your load in one go expecting liquidity pools to be used as a springboard to the next premium/discount array.
Expect up and down price action throughout this month.
114 up for grabs

ZB1! - Low Hanging Fruits Pays The Bills!Please refer to US10Y Yields if you want a detailed, 360 analysis of the bond and yields market as I cover the reasons why price action has been soo tricky recently and what to expect going forward.
Low hanging fruits if important right now and studying the daily timeframe throughout next week will give me the indication whether 116.18 will be a good price for the bonds to reverse from or a springboard for higher prices

Areas of interest long & short in the 30Y TreasuryOverall I feel yields will be rising rather than falling, I am not concerned of what the catalyst might be to cause this but simply following the price action particularly on the 10YR Yield. So that being said I am bearish the 30YR treasury. However, if price retraces down to the lower zone drawn (113) we could see a nice rally up to the higher/larger zone drawn.
At the higher zone (117-118) I would make sense that this un-tested area where the supply exceeded the demand would likely hold and we would see a nice short play out. The target(s) on the short side will be updated once price action has come to fruition as price moves into these zones but a move down to at least the April lows of 106 isn't hard to imagine.

US Bond Slide Began in 2020 — Not Tariff-Driven. Why?The downward pressure did not start with the Liberation Day tariffs on 2nd April.
Based on the 30-year long-term bond price chart, the market peaked in 2020, then broke below a major support line—established since the 1980s—in 2022.
Since that break, US bonds have been on a downward trajectory.
So, what happened in 2020 and 2022 that set the bond market on shaky ground?
In 2020, the massive Covid QE signaled a tipping point in the debt issue that had been discussed for decades. By June 2022, inflation reached 9%, the highest in four decades. Investors grew concerned about the US's dependence on debt as the bond bubble appeared to burst.
Why is the recent tariff shock just a continuation of developments that began back then?
And where are bond prices heading next?
This goes beyond investors offloading its US Treasury holdings after 2nd April.
U.S. Treasury Futures & Options
Ticker: ZB
Minimum fluctuation:
1/32 of one point (0.03125) = $31.25
Disclaimer:
• What presented here is not a recommendation, please consult your licensed broker.
• Our mission is to create lateral thinking skills for every investor and trader, knowing when to take a calculated risk with market uncertainty and a bolder risk when opportunity arises.
CME Real-time Market Data help identify trading set-ups in real-time and express my market views. If you have futures in your trading portfolio, you can check out on CME Group data plans available that suit your trading needs tradingview.com/cme/
Trading the Micro: cmegroup.com/markets/microsuite.html

Why Is the T Bond Heading Down?The downward pressure did not start with the Liberation Day tariffs on 2nd April.
Based on the 30-year long-term bond price chart, the market peaked in 2020, then broke below a major support line—established since the 1980s—in 2022.
Since that break, US bonds have been on a downward trajectory.
So, what happened in 2020 and 2022 that set the bond market on shaky ground?
Why is the recent tariff shock just a continuation of developments that began back then?
And where are bond prices heading next?
This goes beyond investors offloading its US Treasury holdings after 2nd April.
U.S. Treasury Futures & Options
Ticker: ZB
Minimum fluctuation:
1/32 of one point (0.03125) = $31.25
Disclaimer:
• What presented here is not a recommendation, please consult your licensed broker.
• Our mission is to create lateral thinking skills for every investor and trader, knowing when to take a calculated risk with market uncertainty and a bolder risk when opportunity arises.
CME Real-time Market Data help identify trading set-ups in real-time and express my market views. If you have futures in your trading portfolio, you can check out on CME Group data plans available that suit your trading needs www.tradingview.com
Trading the Micro: www.cmegroup.com

ZB1! - Donald Trump Took A Huge Dump In The Bonds MarketIt was only two weeks ago when market participants were cheering on the bond market for it to rally higher.... until al hell broke loose!
120.18 was the initial draw on liquidity before the bond market capitulated into October 2023 BISI.
What's net on the horizon?

B wave almost completeI still think it's a B wave and we can go higher to 5500, however I think a C down is next and it could be dramatic.

US bondswill US bond prices continue their upward trend ? If yes, bonds would be a solid buy rn with a very solid more than +10% chance. If no, bonds will leave its current upwards trend and would test upcoming strong horizontal resistances. this ideas chart will let us track the answer to it.

FERRIS BULLERS DAY OFF - READ DESCRIPTIONWho knows... just posting this to watch.
"In 1930 the republican controlled house of representatives in and effort to alleviate the effects of....
anyone, anyone??
GREAT DEPRESSION....
Passed the....
anyone, anyone??
tariff bill - the Halwey-Smoot Tariff act which
Anyone??
Raised or Lowered? RAISED
Raised tariffs in an effort to collect more revenue for the federal government.
Did it Work?
Anyone, Anyone know the effects?
IT did not work and the United States Sank deeper into the great depression!
-FERRIS BULLERS DAY OFF

Bond Yields Ripping, Will Wall Street Take Notice?Rising yields can usually be associated with a period of risk on. But seeing the 30-year treasury yield rise over 20bp in Asia while Wall Street futures cling on to their cycle lows is anything but usual. In fact, it's a bad omen of things to come.
Matt Simpson, Market Analyst at City Index and Forex.com

ZB1! - Will Donald Trump Pump The Bond Market? On Wednesday, Trump mentioned the need to lower interest rates as the tariffs will have major effects with the rates being where they are at now.
In the last, whenever yields rise, bonds will fall and we have been seeing this from the beginning of September 2024, with minor signs of retracement (factoring Jan 2025 bull run)
Overall, when you look at price action over the past few weeks, it seems as though the bull run has slowed down and there could be a chance for bonds to drop to 116 going into next week.

ZB1! 18/03/25Here we go. Longs on Treasury bonds. Weekly BISI with H4 SMT and displacement. Targeting previous weeks high for this week. FOMC on Wednesday:
- If the Fed signals rate cuts are coming soon (Dovish tone) → Bullish for Bonds
Yields may drop as investors price in lower future rates.
Bond prices rise, benefiting Treasuries and fixed-income investments.
- If the Fed remains cautious and pushes cuts further out (Hawkish tone) → Bearish for Bonds
Yields could stay elevated or even rise if the Fed signals rates will stay high longer.
Bond prices fall, as higher-for-longer rates make existing bonds less attractive.
I'm believing a dovish tone for this FOMC with rates being held. If rates are not held expect a massive shock. Powell's economic projections will also provide key information on their stance.

ZB1! -MASSIVE Week Ahead With Interest Rates There is a strong correlation between bonds and yields and so far, the trajectory of price action for bonds has been in my favour, trailing higher and higher into the weekly premium SIBI.
115.18 is the equilibrium of the most immediate swing high to swing low and I am expecting a draw into this area.
116 is a low hanging, first target for next week that I am aiming for and would like to see how Sundays opening reacts (if that’s the case) with 116.

ZB1! - Perfection With SIBI RejectionThis weeks delivery has efficiently delivered into a PD array mentioned previous weeks back.
Although bullish, the goal was not to predict the weeks close, just anticipate the draw on liquidity.
Aiming for low hanging fruits, I am looking at the 115.18 weekly EQ as a possible draw going into next week.

$BONDS MMSMWhen analyzing the bonds, we identified an SMT between them at a PDA located in the monthly premium region, further reinforcing the possibility of a DXY rally and a drop in EURUSD, along with bond depreciation. However, to validate this scenario, we still need confirmations on the daily chart to ensure that the bias remains aligned with the market structure.
