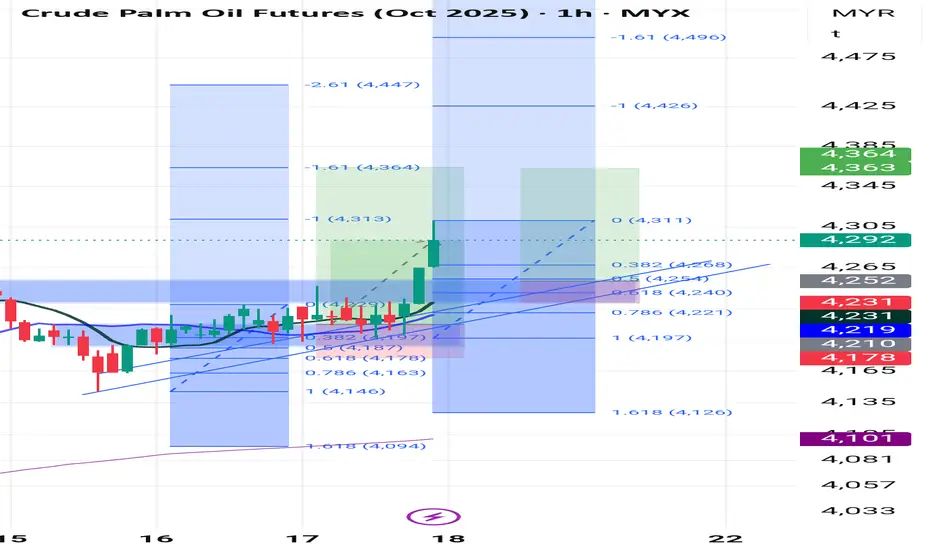
continuation bullish modeBased on the chart tf 1h, looks still strong to bullish mode. retracement area maybe between 4254 to 4230 which is area hh before (major market structure and Fibonacci retracement 0.5 to 0.618. and theres also strong support trendline in that area. however, will see how much the gap this morning .18
Related commodities
11/7/25 FT Selling or, Sideways and Another Leg Up?
Thursday’s candlestick (Jul 10) was a bear doji closing slightly below the middle of its range.
In our last report, we said traders would see if the bears could create a strong bear bar closing near its low, or if the market would trade lower, but close with a long tail below or above the middl

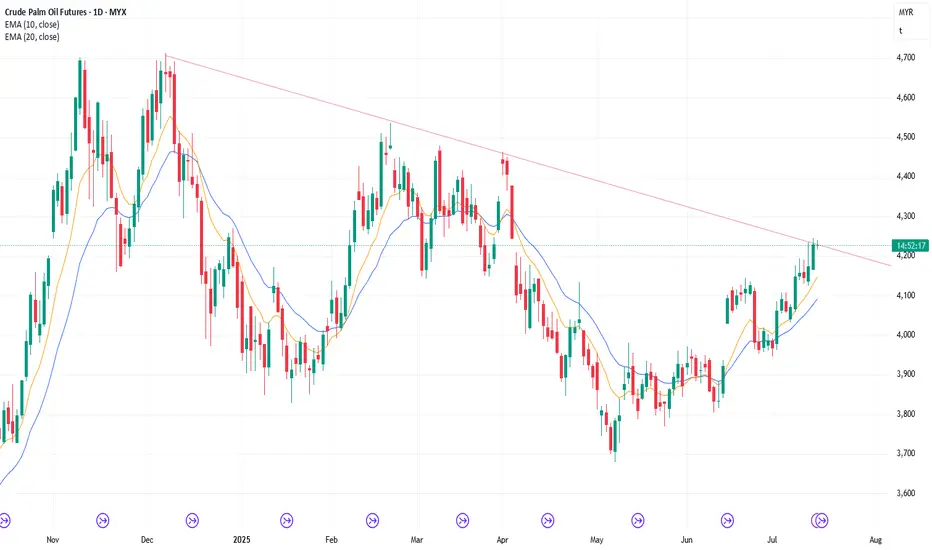
18/7/25 Weekly Candlestick To Close Near Its High or Tail Above?
Thursday’s candlestick (Jul 17) was a doji bar with a long tail above.
In our last report, we said traders would see if the bulls could create a follow-through bull bar testing the July 14 high, or if the market would form a lower high (versus July 14) and be followed by some selling pressure i
17/7/25 Retest Jul 14 High or Weak Follow-through Buying?
Wednesday’s candlestick (Jul 16) was an inside bull bar closing near its high.
In our last report, we stated that traders would observe whether the bears could create a follow-through bear bar, even if it were just a bear doji, or if the market would trade higher to retest the July 14 high. If
16/7/25 Can Bears Create A Follow-through Bear Bar?
Tuesday’s candlestick (Jul 15) was a big bear bar closing in its lower half with a prominent tail below.
In our last report, we said traders would see if the bulls could create a strong breakout above the bear trend line, or if the market would trade sideways and stall around the bear trend lin
15/7/25 Bulls Need Strong FT Buying Above Bear Trendline
Monday’s candlestick (Jul 14) was a bull bar closing near its high around the bear trend line area.
In our last report, we said traders would see if the bulls could create a retest of the July 11 high or if the market would trade sideways and stall around the bear trend line area (4230-50) in t
14/7/25 Bulls Need Strong Breakout Above Bear Trend Line
Friday’s candlestick (Jul 11) was a bull bar closing slightly below the middle of its range with a long tail above.
In our last report, we said traders would see if the bears can create a strong bear bar closing near its low, or if the market would continue to trade sideways with limited follow

10/7/25 Can The Bears Create Sustained FT Selling?
Wednesday’s candlestick (Jul 9) was a bull doji closing in its lower half with a long tail above.
In our last report, we stated that traders would observe whether the bulls could create a follow-through bull bar above the June 20 high, or if the market would trade slightly higher but close with

9/7/25 Can Bulls Create More FT Buying?
Tuesday’s candlestick (Jul 8) was a big bull bar with a small tail above and closing above Jun 20 high.
In our last report, we said traders would see if the bulls could create a follow-through bull bar testing the July 4 high, or if the bears would be able to create a strong bear bar closing be

8/7/25 No FT Selling, Can Bulls Create FT Buying or No?
Monday’s candlestick (Jul 7) was a bull bar closing near its high.
In our last report, we said traders would see if the bears could create a strong bear entry bar, or if the market would trade slightly lower but close with a long tail below or with a bull body instead. If this is the case, it c

See all ideas
Summarizing what the indicators are suggesting.
Neutral
SellBuy
Strong sellStrong buy
Strong sellSellNeutralBuyStrong buy
Neutral
SellBuy
Strong sellStrong buy
Strong sellSellNeutralBuyStrong buy
Neutral
SellBuy
Strong sellStrong buy
Strong sellSellNeutralBuyStrong buy
A representation of what an asset is worth today and what the market thinks it will be worth in the future.
Displays a symbol's price movements over previous years to identify recurring trends.
Frequently Asked Questions
The current price of USD Malaysian Crude Palm Oil Calendar Futures (Jan 2026) is 997.00 USD — it has fallen −0.98% in the past 24 hours. Watch USD Malaysian Crude Palm Oil Calendar Futures (Jan 2026) price in more detail on the chart.
Track more important stats on the USD Malaysian Crude Palm Oil Calendar Futures (Jan 2026) chart.
The nearest expiration date for USD Malaysian Crude Palm Oil Calendar Futures (Jan 2026) is Jan 30, 2026.
Traders prefer to sell futures contracts when they've already made money on the investment, but still have plenty of time left before the expiration date. Thus, many consider it a good option to sell USD Malaysian Crude Palm Oil Calendar Futures (Jan 2026) before Jan 30, 2026.
Open interest is the number of contracts held by traders in active positions — they're not closed or expired. For USD Malaysian Crude Palm Oil Calendar Futures (Jan 2026) this number is 820.00. You can use it to track a prevailing market trend and adjust your own strategy: declining open interest for USD Malaysian Crude Palm Oil Calendar Futures (Jan 2026) shows that traders are closing their positions, which means a weakening trend.
Buying or selling futures contracts depends on many factors: season, underlying commodity, your own trading strategy. So mostly it's up to you, but if you look for some certain calculations to take into account, you can study technical analysis for USD Malaysian Crude Palm Oil Calendar Futures (Jan 2026). Today its technical rating is strong buy, but remember that market conditions change all the time, so it's always crucial to do your own research. See more of USD Malaysian Crude Palm Oil Calendar Futures (Jan 2026) technicals for a more comprehensive analysis.