Momentum to the buy sideThe S&P 500 daily chart is exhibiting momentum to the buy side with a positive reaction to earnings and economic reports. The next challenge will be a close above 6360 per Friday.
ES1! trade ideas

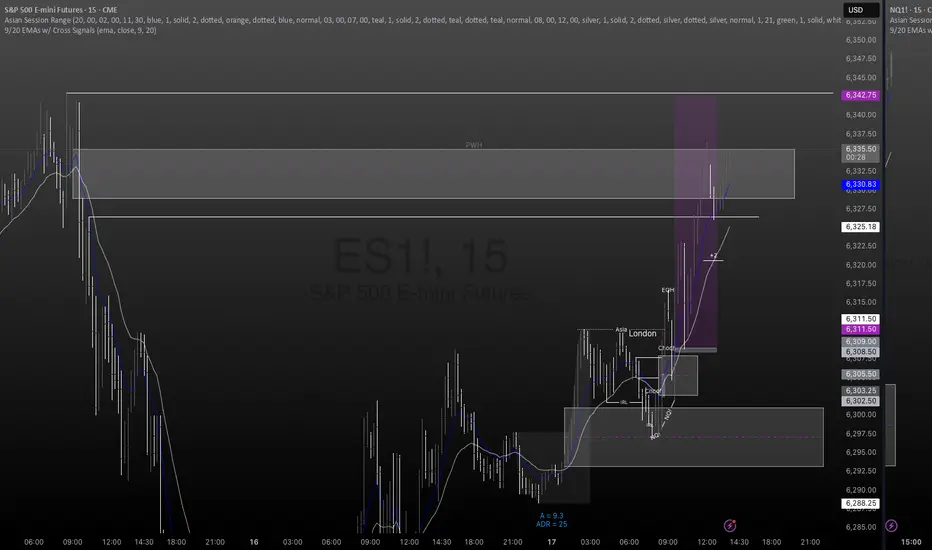
ES! Longs 7RRCRT for Bullish Daily bias
9.30 Sweep on NQ, ES failed to take lows but reacted from 15m FVG
Targets Daily CRT candle high for 7RR clean trade
Tap In!!
#EUBOOGIE
Congestion Action vs Congestion Exit – Mastering the TransitionWhen markets go quiet and churn sideways, it’s easy to get lost in the noise. But inside that congestion lies opportunity — if you understand the difference between "Congestion Action" and "Congestion Exit." Here’s how to apply Drummond Geometry to trade these phases with precision:
🔹 Congestion Action
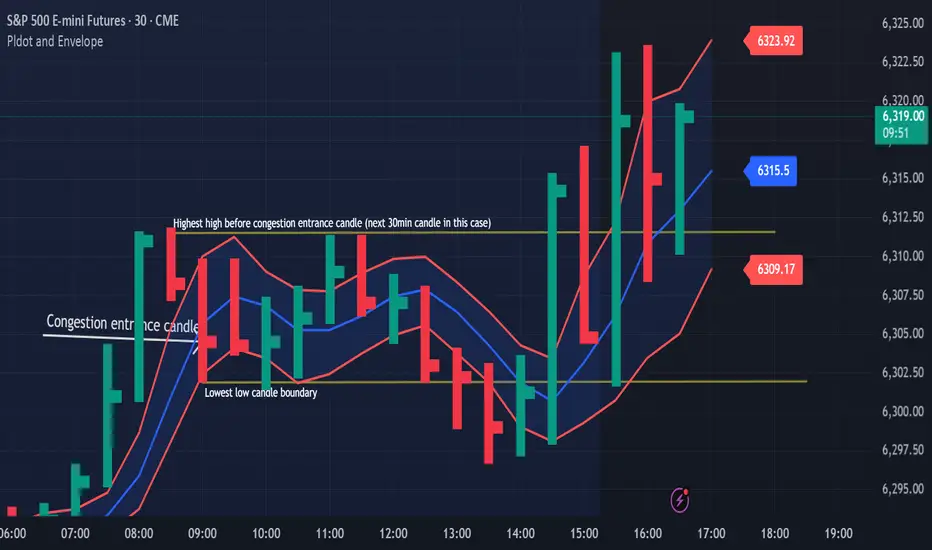
Congestion action is when the market is not ready to trend — it's swinging back and forth within a defined range, between a strong block level and a well-established dotted line. Think of it as a "resting zone" before the next directional move.
📏 Original Confines: Highest high and lowest low after a congestion entrance as shown on the chart
🚧 Expanded Confines: Price temporarily breaks out of the range but doesn’t establish a trend (3 closes on the came side of the PLdot (blue line)).
🧲 This is where scalpers and range traders thrive. Look for setups near envelope confines and use nearby energy fields.
✅ Trade Plan: Play the range — buy support, sell resistance — until proven otherwise.
🔸 Congestion Exit
This is when the market transitions from ranging to trending — a trend run begins from within the congestion zone.
🚀 First bar of a new trend closes outside the congestion confines (either the block level (highest high on the chart) or the dotted line (the low on the chart)).
📊 The next bar must confirm with a trend run close — if not, it’s a failed breakout. You can see on the chart that price tried to trend lower but the trend was not confirmed!
⚡ Patterns to watch:
Energy pushing in the direction of the exit (PL Dot push, c-wave continuation).
6-1 lines against the breakout direction disappear.(Not visible in this version)
Resistance/support against the exit breaks.
✅ Trade Plan: Enter on breakout confirmation, not just the breakout bar. Measure energy and watch the follow-through.
🧭 Tip:
Don't get faked out. If price re-enters congestion after a breakout, re-draw the boundaries — the old congestion is no longer valid.
🔥 Bottom Line:
Congestion Action is where the market breathes. Congestion Exit is where it moves. Mastering the handoff between the two gives you a decisive edge.
SP500 ES Weekly Recap | ATH Deviation → Pullback or Powell Pump?Overview:
ES made a new all-time high last week, sweeping the previous high with strong momentum.
However, the move ended up being a deviation, and the price quickly reversed — suggesting short-term exhaustion.
Bearish Scenario (Baseline):
🔻 Rejection from ATH
🔻 Possible retracement targets:
12H Swing Low (turquoise line)
Weekly Fair Value Gap (purple zone)
I believe a pullback into those levels could provide bullish continuation setups for new highs. I’ll look for LTF confirmation once price reaches those zones.
Bullish Scenario (Catalyst-Driven):
🚨 If Fed Chair Powell resigns this week (a circulating macro rumor), the market may not wait for retracement.
This could lead to an aggressive breakout, driving ES and risk assets straight into new ATHs again.
Plan:
✅ Watch for LTF confirmation after pullback
✅ Stay open to both scenarios
✅ Focus on HTF bullish structure as long as key levels hold

Neutral zone structureThe daily chart in the S&P 500 has created a neutral zone structure. This implies a sideways move, which is what I'm looking for but with a positive close.

DIYWallSt Trade Journal: How I Navigated Powell Firing Rumors & 07/16/25 Trade Journal, and ES_F Stock Market analysis
EOD accountability report: +428.75
Sleep: 7 hours
Overall health: Good
VX Algo System Signals from (9:30am to 2pm)
— 4:17 AM Market Structure flipped bullish
— 9:50 AM Market Structure flipped bearish
— 12:00 PM VXAlgo NQ X3 Buy Signal
— 1:02 PMMarket Structure flipped bullish
What’s are some news or takeaway from today? and What major news or event impacted the market today?
Today was a crazy trading day with a bunch of wild moves because Trump said they were going to fire Powell and then cancelled the threat.
Overall health and sleep have been good this week and our trading balance is reflecting that.
News
— 10:30 AM *SCOTT BESSENT: “FORMAL PROCESS” TO REPLACE FED CHAIR POWELL UNDERWAY
— 12:11 PM
*TRUMP ASKED IF HE WILL FIRE POWELL: NOT PLANNING ON DOING ANYTHING
What are the critical support levels to watch?
--> Above 6290= Bullish, Under 6280= Bearish
Video Recaps -->https://www.tradingview.com/u/WallSt007/#published-charts

Using 1 min time frame for entries on VX algo & day tradingwhat time frames do you use to confirm entries outside of a buy signal?
If I am day trading, I will mainly use the 1 minute time frame to look for moving average support and resistance, and read the candle stick patterns as well from that chart.
However, there are times I'll switch to a 5 minute and 10 minute time frame to take a look at levels for moving averages and see what the candle stick patterns are from there.
So for example, today we had 3 of the x1 sell signals around 9:31, so we pull up the 1 min chart, we are getting confirm break of the 1st moving average support = bearish confirmation #1, follow by DHC = Bearish confirmation #2 , and the sell signal is already 3 confirmations, so we need to short ASAP.

Lack of commitmentThere was a lack of commitment from buyers on the daily chart in the S&P 500. Although the session started out with buyers moving the market to new highs, it failed to maintain that upward momentum. This volatility could continue on Wednesday with the release of PPI.

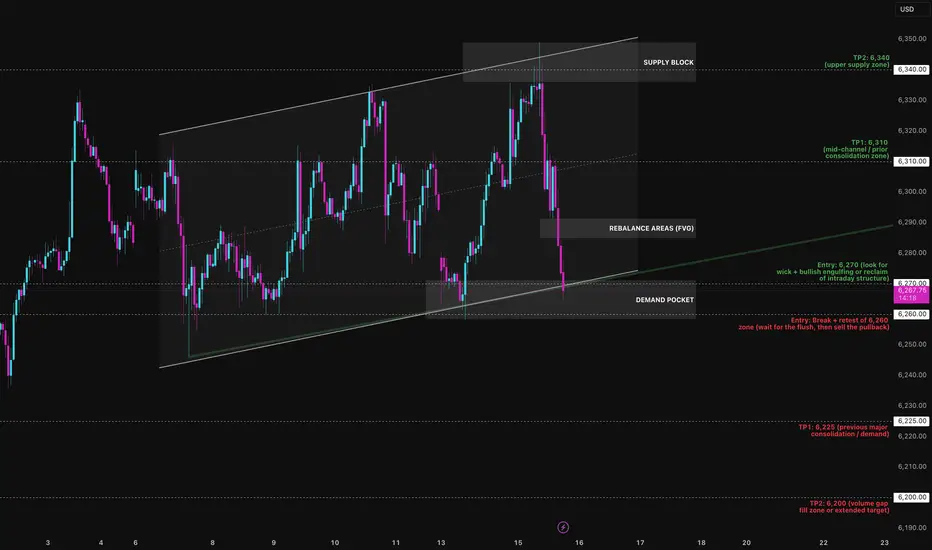
Bounce or Burial? The MES Funeral is Loading…The Micro E-mini S&P is walking a tightrope. After weeks of controlled movement within a rising parallel channel, price has now slammed into the lower boundary and the next move will define the week's direction.
I've mapped the channel from the July 2 low, with multiple precise touches on both upper and lower boundaries. Currently, MES is printing a heavy rejection from the 6360 supply zone, falling nearly 90 points back to the channel’s base near 6270.
Preferred Bias: Short-term Bearish Until Reclaimed
While the macro structure is still technically bullish (channel intact), momentum, supply pressure, and volume structure suggest sellers are gaining the upper hand:
- Mid-channel equilibrium (EQ) at 6310 was sliced without bounce
- No absorption yet at 6270 demand box
- Previous rally legs show decreasing impulsiveness — weakening buyers
Unless bulls aggressively defend 6270 with a reclaim candle or V-shape wick, this looks like a liquidity tap + structural breakdown loading up.
Bearish Play: “Channel Collapse Incoming”
Entry: Break + retest of 6,255–6,260 zone
SL: 6,275 (above retest structure)
TP1: 6,225
TP2: 6,180
Confluences:
- Channel break
- No support bounce at EQ
- Supply rejection at 6360
- Volume void below 6250
Bullish Play (Countertrend Fade): “Defend the Line”
Entry: Bounce off 6,270 with bullish engulfing or reclaim
SL: 6,255 (invalidate structure)
TP1: 6,310 (mid-channel)
TP2: 6,340–6,360 (supply reload zone)
Only valid if buyers show up with real intent don’t pre-empt.
This is a textbook inflection zone. If the lower trend line breaks and retests from below, momentum favours the bears. If bulls trap and reverse this drop at 6270, we could see a fast grind back to 6360 but as of now, all signs lean toward breakdown over bounce.
Positioning itselfThe structure in the S&P 500 daily chart implies a market with a bias to the upside positioning itself for the release of fundamental information this week.

DIYWallSt Trade Journal:The Importance of Your First Trade **07/14/25 Trade Journal, and ES_F Stock Market analysis **
EOD accountability report: +158.75
Sleep: 7 hours
Overall health: Good
** VX Algo System Signals from (9:30am to 2pm) **
— 8:00 AM Market Structure flipped bullish on VX Algo X3!
— 10:30 AM VXAlgo NQ X1DD Buy Signal
— 11:50 AM VXAlgo ES X1 Sell Signal
— 1:00 PM VXAlgo NQ X1DD Buy Signal
**What’s are some news or takeaway from today? and What major news or event impacted the market today? **
I need to really be careful with my first trade and making sure it is a high probability trade, otherwise a bad early start is likely to ruin my whole day.
News
— 1:42 PM *TRUMP TO UNVEIL $70 BILLION IN AI AND ENERGY INVESTMENTS
— 4:08 PM *S&P 500 ENDS HIGHER AS STOCKS RISE AFTER TRUMP SAYS OPEN TO DEALS ON TARIFFS
**What are the critical support levels to watch?**
--> Above 6295= Bullish, Under 6285= Bearish
Video Recaps -->https://www.tradingview.com/u/WallSt007/#published-charts

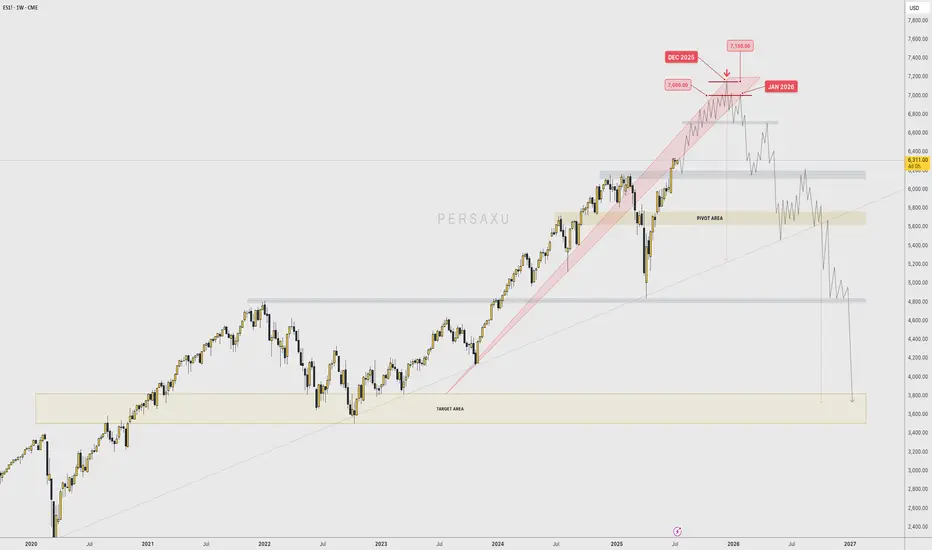
BEAR WITH ME... First of all, I'm getting into the field of other players and trying to call their type of shots.
I don't intend to come across as ignorant when it comes to this market, since I only trade gold and I have seen FOREX traders try to predict gold and get it completely wrong.
I have NO ARGUMENTS WHATSOEVER with which I could back this PREDICTION up; NOT PROJECTION...
As a matter of fact, Technically speaking , the " PROJECTION " would actually be BULLISH , because price is entering a "discovery" phase, In which there is no previous high to "top" a potential impulse with.
When price is making ATH, YOU CAN'T CALL THE TOP UNTIL THE TOP IS FORMED.
That being said, I only want to have this on my profile for personal use and see if my "prediction" comes a reality between December 2025 and February 2026.
--
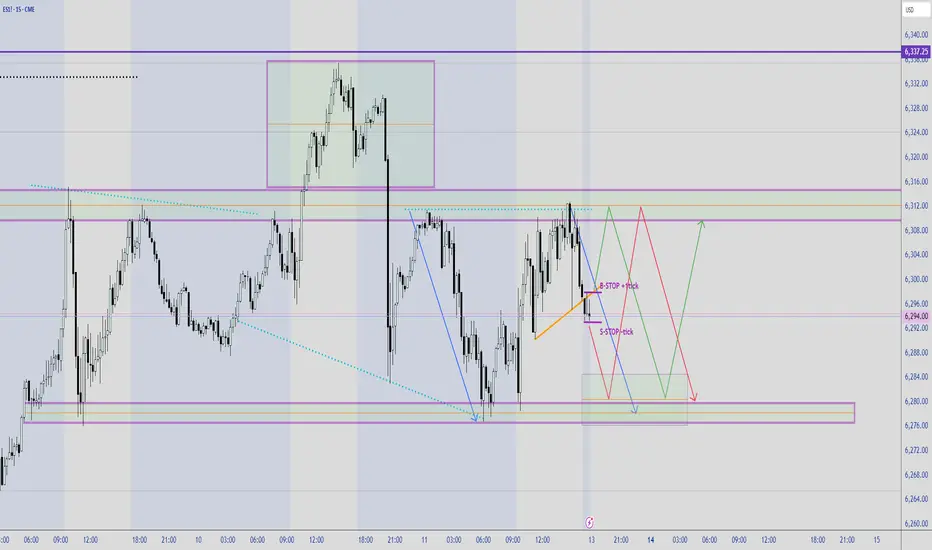
TRADING RANGE - ES!DT on the daily, ES! may pullback a little bit lower before moving up and breakout to a establish a new high. Last Friday was a High2 pullback, close lower than the previous bar. Looks like a consolidation or a trading range between 6336 to 6246. On the 15min paints 2 potential move either up or down, and bias seems to be bearish to complete the symmetry of the previous down leg then reverse back up. Rule of thumb buy or sell stop 1 tick above or below the marked lines.
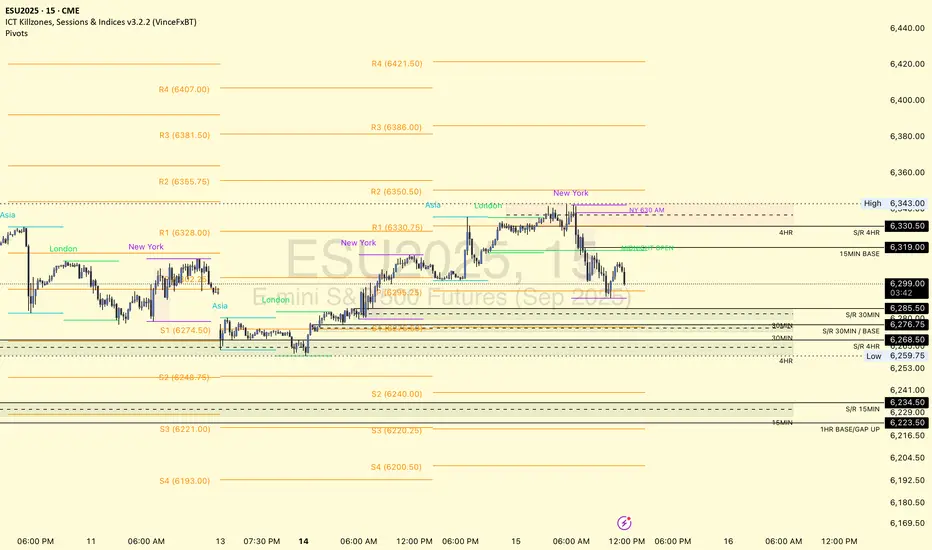
Live Setup for ES NY am session (14 July, 2025)MY bias: I expect price to make move lower at NY am session and target 6,259 price level.

S&P 500: Time For A Pullback??
In this Weekly Market Forecast, we will analyze the S&P 500 for the week of July 14 - 18th.
The S&P 500 had a strong week, until Tariff Tensions Friday arrived.
This by itself doesn't mean we should start looking for sells. With Tuesday CPI Data coming, this short term consolidation is to be expected until the news is announced.
Let the markets pick a direction, and flow with it.
Have a plan of action in place so you can react to the price action promptly!
Enjoy!
May profits be upon you.
Leave any questions or comments in the comment section.
I appreciate any feedback from my viewers!
Like and/or subscribe if you want more accurate analysis.
Thank you so much!
Disclaimer:
I do not provide personal investment advice and I am not a qualified licensed investment advisor.
All information found here, including any ideas, opinions, views, predictions, forecasts, commentaries, suggestions, expressed or implied herein, are for informational, entertainment or educational purposes only and should not be construed as personal investment advice. While the information provided is believed to be accurate, it may include errors or inaccuracies.
I will not and cannot be held liable for any actions you take as a result of anything you read here.
Conduct your own due diligence, or consult a licensed financial advisor or broker before making any and all investment decisions. Any investments, trades, speculations, or decisions made on the basis of any information found on this channel, expressed or implied herein, are committed at your own risk, financial or otherwise.


Profit takingThe structure in the S&P 500 daily chart implies profit taking on Friday. The expectation is there will not be dramatic selling on Monday. It is important to keep in mind a broader structure is a potential double top which could present a long-term high for this market.

DIYWallSt Trade Journal: Missed Entry & Climbing Back From Loss **07/11/25 Trade Journal, and ES_F Stock Market analysis **
EOD accountability report: -46.25
Sleep: 5 hours
Overall health: Good
** VX Algo System Signals from (9:30am to 2pm) 3/3 success**
— 9:41 AM Market Structure flipped bearish on VX Algo X3!
— 10:15 AM VXAlgo ES X7 Buy signal,
— 10:23 AM Structure flipped bullish
— 11:30 AM VXAlgo ES X3DD Sell Signal
**What’s are some news or takeaway from today? and What major news or event impacted the market today? **
I was a little busy this morning and missed the chance to short the market at MOB with Bearish market structure at 9:30, so I had to wait for the next chance but when i shorted the MOB on the move up, the X7 buy signal came out and pushed market structure bullish.
Ultimately If i had a better entry on my short, I would have been okay, but since i shorted early, i got stopped at at 6306 and it ended up dropping right after that. So the day actually started pretty bad and i was -300 from there and was just trying to climb back and forth the next few hours.
News
*LATEST TARIFF THREATS COULD DELAY RATE CUTS, CHICAGO FED’S GOOLSBEE SAYS - WSJ
**What are the critical support levels to watch?**
--> Above 6290= Bullish, Under 6280= Bearish
Video Recaps -->https://www.tradingview.com/u/WallSt007/#published-charts

TACO about to become TUFTThe acronym "TACO" has been adopted as a market slogan to explain the shocking volatility brought on by Trump's follow through with his campaign promises to enact and/or adjust tariff's in the USA on its trading partners around the world. The mere mention resulted in a 1,334 point sell-of culminating in April. When Trump walked back {read: backed off in terms of immediacy of effect..} the market "rallied."
However, at the bottom of the lows, ES1=4,832, all strength fell out of the index and all Minor pattern lows were breached. This leads me to believe that 4,832 was just that...a LOW and not a bottom. To resolve this aspect of the price pattern in relation to strength, price and go for a higher low on less strength, or a lower low on more strength...either way, this can only result in a sell-off of .618 of 1,334, or approximately 824 points. Assuming participants intend to go lower on more strength, the bottom will be struck approximately 2,159 points lower in the 4,200 region, since this irregular B has complicated the direct 1.0 hit in the 4900 region. Still possible, but unlikely we swing within 100 points of the low, all while strength falls out and holders get brave.
The other problem I see with this wave higher is that it is sloppy. How?
(1) It is sloppy first of all because as it approached its 1.382 level off the first wave up (at least as noted by a premier Elliot Wave pub) it basically ripped right through. What is healthy for an impulse is to approach the 1.382, then pause for a retracement to the 1.0.
(2) The wave began with an obvious 3 wave pattern, and I was surprised to see prominent publications accepting such an obvious corrective pattern as the start of a true impulse upward. The 3 waves that took us to 5,528.75 are accordingly labeled as the A wave on this chart. Even if this is an Ending Diagonal, which is a motive wave, but not an impulse, which starts with 3 waves, we should at minimum get overlap at the 5,528.75 level in order to continue higher.
(3) We are getting mixed MACD readings between the daily and hourly charts right where price would be expected to blast off if the daily is correct and would be expected to fail if the hourly bearish divergence is correct.
As we approach this 1.618 level of 3,398.75 on ES2, off the pattern as stated, we can use it to guage the downside expectation. A direct hit and sell-off might lead us to the conclusion that the 4900s are in order or even 5400s, but a failure here, 10-20 points off, would be considered more bearish. Giving the benefit of the doubt to price, I have included various ways that price can regain its footing, here stating a primary count that this is the Minor A of an intermediate (B) wave, because it has been very bullish, very disorganized, and has created a higher MACD reading on the daily chart. Alt count is that this is All of Intermediate (B), and Intermediate C should commence to carry price into the low 4k region.
If price is to go higher, it must overcome a 3 wave start, an irregular and disorganized pattern, and conflicting strength readings...not to mention, a Fundamental hurdle that Trump Ultimately Follows Through.

Inside to higher Although the S&P 500 daily chart broke to the downside the Asia session is indicating buyers are supporting this market. It implies an inside day within Thursday’s range to a higher close going into the weekend.

AMP Futures - How to export data from your Trading PanelIn this idea, we will demonstrate how to export data from your Trading Panel using the TradingView platform.
Unfortunately, the recording did not show the demonstration of the exported CSV files; however, as long as you follow the steps provided, you will be able to export the proper data.

MES1! Stacked Rejection & Distribution into NY ClosePrice is stalling above PDH after tapping a clear HVRA (Supply) zone. We’re seeing layered rejection with a Secondary Distribution Shelf forming beneath it a classic signature of trapped longs and passive seller absorption.
If structure fails to hold above the rejection zone, we expect a reversion through the inefficiency and potential rotation into the demand base.
Key Zones & Structure
HVRA (Supply): 6345–6355 – Liquidity exhaustion, failed breakout
Secondary Distribution Shelf: 6315–6325 – Trap zone, weak re-test
Mean Reversion Target: 6285–6295 – Execution gap, inefficient rotation
Absorption Zone (Demand): 6260–6275 – Institutional long buildup
Bearish Trade Idea
Entry: 6332 (within HVRA)
Stop: 6342 (above HVRA high)
TP1: 6300 – Break of shelf
TP2: 6288 – Fill inefficiency
TP3: 6270 – Rotation into demand
R:R: Approx. 1:2.8 / 1:4.2 depending on target
Staakd Outlook
Stacked rejection with no volume follow-through above PDH. Unless NY reclaims 6330+ with force, structure favoUrs reversion to inefficiency and absorption zone below.
Follow for post-session confirmation and Friday morning bias update.
Staakd Bias: Bearish Lean ★★★★☆
