Extended rally off April lows should be completing imminentlyEvery so often, a market move defies conventional expectations of retracement—and the rally off the Liberation Day lows is exactly that. It’s extended longer and climbed higher than even the most bullish forecasts imagined in early April. No one remembers the calls for an imminent recession by most large Wall Street firms.
Now, we're pushing into yet another all-time high—despite glaring negative MACD divergence and a financial media landscape that’s nothing short of euphoric.
The narratives being pushed? Honestly, it’s hard to write them with a straight face:
Tariffs are no longer inflationary. Apparently, I wasted time and tuition learning international trade theory and macroeconomics. Who knew deficits and trade imbalances didn’t matter anymore? Who pays tariffs again? ...never mind.
Weak momentum since mid-May signals not exhaustion—but an “unhealthy absence” of institutional selling, which apparently means the retail trader is in full control now. Because that always ends well... right?
MESZ2021 trade ideas
Using 1 min time frame for entries on VX algo & day tradingwhat time frames do you use to confirm entries outside of a buy signal?
If I am day trading, I will mainly use the 1 minute time frame to look for moving average support and resistance, and read the candle stick patterns as well from that chart.
However, there are times I'll switch to a 5 minute and 10 minute time frame to take a look at levels for moving averages and see what the candle stick patterns are from there.
So for example, today we had 3 of the x1 sell signals around 9:31, so we pull up the 1 min chart, we are getting confirm break of the 1st moving average support = bearish confirmation #1, follow by DHC = Bearish confirmation #2 , and the sell signal is already 3 confirmations, so we need to short ASAP.

DIYWallSt Trade Journal:$238 Lessons From Monthly Expiration07/18/25 Trade Journal, and ES_F Stock Market analysis
EOD accountability report: +238.75
Sleep: 5. hours
Overall health: Was working late last night and didn't get much sleep.
VX Algo System Signals from (9:30am to 2pm)
— 8:30 AM Market Structure flipped bullish on VX Algo X3!
— 10:30 AM Market Structure flipped bearish on VX Algo X3!
— 11:10 AM VXAlgo ES X1 Buy signal (didn't work that well)
— 12:10 PM VXAlgo NQ X1DD Sell Signal
— 12:19 PM Market Structure flipped bullish on VX Algo X3!
What’s are some news or takeaway from today? and What major news or event impacted the market today?
Today was monthly expiration for options and we got a lot of X7 Sell signals but structure was bullish so I tried to take a long at MOB and got burned. Flipped bearish and started shorting the rest of the day and ended up making money back.
News
*US STOCKS MOVE LOWER AFTER REPORT SAYS TRUMP PUSHES FOR 15-20% MINIMUM TARIFF ON ALL EU GOODS
What are the critical support levels to watch?
--> Above 6335= Bullish, Under 6315= Bearish
Video Recaps -->https://www.tradingview.com/u/WallSt007/#published-charts

Gold silver7.22 2025 gold is at a pivotal Junction and it looks bullish but it's come to ABCD patterns and reversal patterns that indicate that it could go lower and the silver it doesn't look quite the same but it's moving to levels that it hasn't been for a long period of time so this may indicate the possibility of a breakout higher. There are more details in the video and I think that coffee May go higher even though it may not look like a good trade but it's a trade you can take with very small risk and I talk about it more in the video. Palladium traded to an ABCD pattern and it looks very bullish but anything that looks like an ABCD pattern that's been filled you have to be concerned that it's going to reverse and take the market in the other direction.

NASDAQ: Still Bullish! Look For Valid Buys!Welcome back to the Weekly Forex Forecast for the week of July 21-25th.
In this video, we will analyze the following FX market:
NASDAQ (NQ1!) NAS100
The Stock Indices are strong, and showing no signs of selling off. Buy it until there is a bearish BOS.
Enjoy!
May profits be upon you.
Leave any questions or comments in the comment section.
I appreciate any feedback from my viewers!
Like and/or subscribe if you want more accurate analysis.
Thank you so much!
Disclaimer:
I do not provide personal investment advice and I am not a qualified licensed investment advisor.
All information found here, including any ideas, opinions, views, predictions, forecasts, commentaries, suggestions, expressed or implied herein, are for informational, entertainment or educational purposes only and should not be construed as personal investment advice. While the information provided is believed to be accurate, it may include errors or inaccuracies.
I will not and cannot be held liable for any actions you take as a result of anything you read here.
Conduct your own due diligence, or consult a licensed financial advisor or broker before making any and all investment decisions. Any investments, trades, speculations, or decisions made on the basis of any information found on this channel, expressed or implied herein, are committed at your own risk, financial or otherwise.

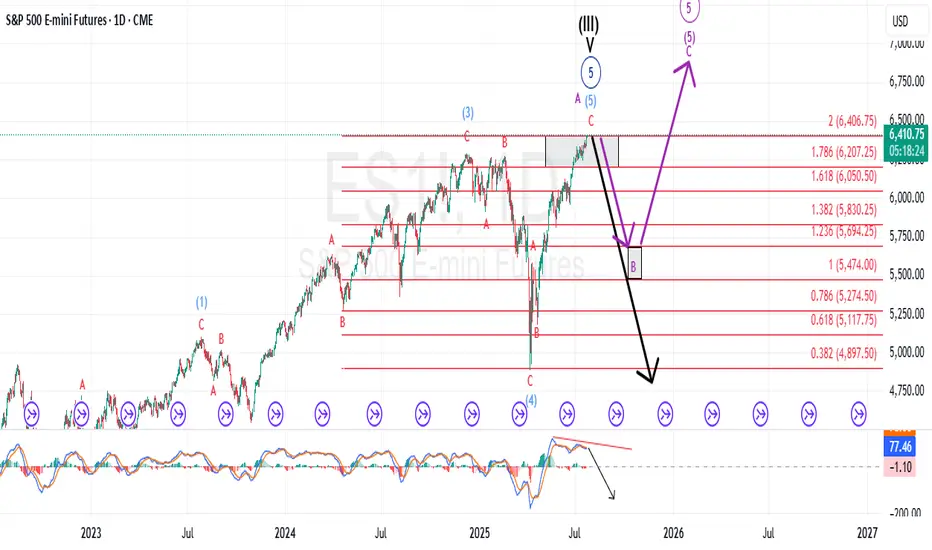
S&P500: Rally ContinuesYesterday, the S&P 500 managed to notch modest gains once again. In line with our primary scenario, the ongoing magenta wave (B) is likely to continue climbing toward resistance at 6,675 points. Once this corrective upswing reaches its peak—still below that level—we anticipate a pullback as part of wave (C), which should drive the index below support at 5,127 points. Beneath this threshold, our green long Target Zone spans from 4,988 to 4,763 points. We expect the low of wave (C) and the conclusion of the broader green wave to occur within this range. From there, a sustained rally is expected to unfold in wave , which should lift the index above resistance at 6,675 points and complete the cyclical blue wave (III). As a result, this price range can be considered for long entries. The alternative scenario, which calls for a direct breakout above the 6,675-point level without a prior pullback, remains in play with a 40% probability.
📈 Over 190 precise analyses, clear entry points, and defined Target Zones - that's what we do (for more: look to the right).

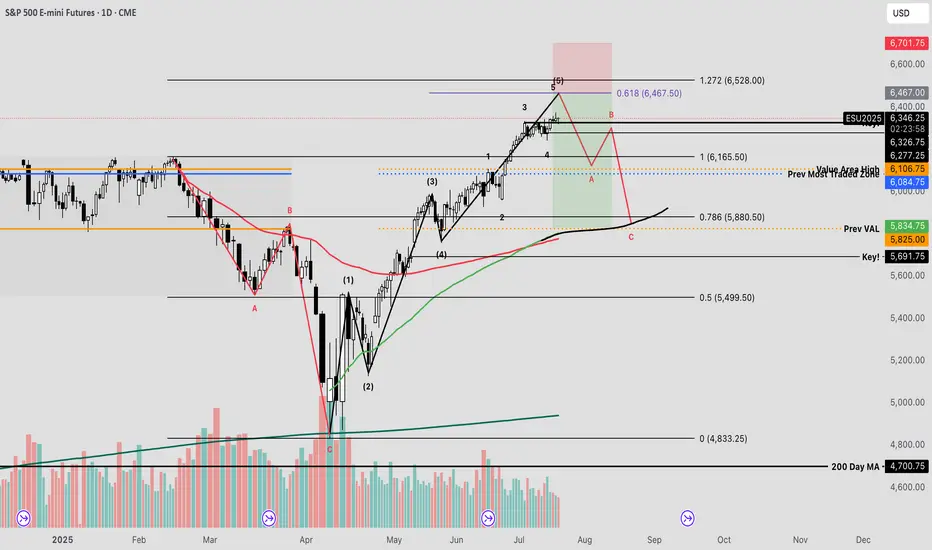
SPY The Final Countdown Since the April lows, equity markets have exhibited strong performance, with many stocks appreciating by nearly 100%—some even exceeding that threshold. Given the velocity of this rally, a corrective pullback may be imminent before the broader uptrend resumes.
The current reading on the Fear & Greed Index places market sentiment firmly within the "extreme greed" territory—historically a zone where investors often begin to lock in profits or initiate contrarian positions against the prevailing trend.
From a technical standpoint, I’ve conducted an Elliott Wave impulse analysis to evaluate the recent price structure. This method, which utilizes Fibonacci-based mathematical relationships, provides insight into the expansion and contraction phases of market cycles.
Using the trend-based Fibonacci extension tool, one can estimate potential termination zones for impulse waves. In the current scenario, the fifth wave appears to be approaching completion. By analyzing the proportional relationships between waves 1, 3, and 4, a key confluence level emerges at the 61.8% extension—commonly referred to as the “golden pocket”—just above the 6400 level on the futures chart.
I plan to set alerts at this price level to secure profits, hedge existing positions, and potentially initiate a short trade—should market structure confirm a reversal through a valid breakdown trigger.
AMP Futures - How to view Deep level 2 data (DOM)In this idea we will discuss what is required in order for you to access deep level 2 data on the Depth of Market (DOM) using Tradingview.

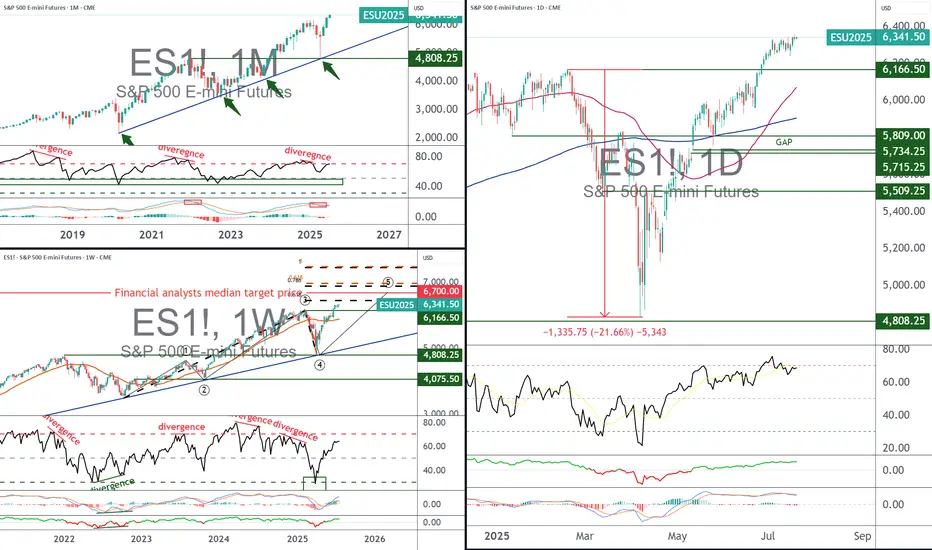
S&P 500, what target for the end of 2025?With the S&P 500 index (the S&P 500 future contract is used as a reference in this analysis) having surpassed its all-time record of 6,165 points at the end of June, and still against a backdrop of trade diplomacy, what technical and fundamental price target can we aim for over the next 12 months? 6,500 points? 6,700 points? 7,000 points? To answer this question, we need to cross-reference the median opinions of financial analysts with the theoretical objectives of technical analysis to assess the remaining potential of the S&P 500.
In terms of fundamentals, the new deadline for trade negotiations between the United States and its trading partners is Friday August 1, and the Fed is unlikely to cut the federal funds rate on Wednesday July 30.
1) Fundamentals and technical analysis: what are the common targets for the end of 2025?
I'd like to start by looking ahead to the next few months and establishing an average target for the S&P 500 between now and the end of the year. Naturally, this is a medium-term projection (several months) and leaves room for short-term correction/retraction phases. Bear in mind that even an underlying uptrend alternates between bullish impulses and short-term correction periods.
According to FactSet, financial analysts' median price target for the S&P 500 over the next 12 months is 6,700 points. As for the theoretical price targets of technical analysis, they are based here on Elliott waves and Fibonacci extensions, giving a range of between 6450 points and 6900 points.
The chart below shows the Japanese candlesticks in weekly data for the S&P 500 future contract with theoretical technical targets based on Fibonacci extensions.
The chart below comes from FactSet and represents the median target of financial analysts for the S&P 500 index with a 12-month horizon
2) Market tops are built on euphoria, and at this stage, sentiment indicators are not in a state of extreme optimism
Is the underlying bullish move under threat from market sentiment that has become over-optimistic? The answer is negative, according to the latest sentiment survey from the American Association of Retail Investors (AAII). The seller's tank is still full, with 39% expecting a bear market. Bear in mind that final market tops are built in euphoria, when the % of sellers falls to the bottom.
The survey below is conducted once a week by the American Retail Investor Association
3) Quantitative analysis does not yet describe an extreme overbought technical situation for S&P 500 stocks
Another approach, the quantitative approach to financial markets, also shows that the market is not yet in a risk zone of hyper-exposure to buying. The percentage of S&P 500 stocks above the 50-day moving average is not yet in the overbought zone.
In conclusion, although there will always be short-term technical corrections, the underlying uptrend of the S&P 500 is not threatened at this stage.
The blue curve below represents the percentage of S&P 500 stocks above the 50-day moving average. This is a quantitative analysis of the financial markets.
DISCLAIMER:
This content is intended for individuals who are familiar with financial markets and instruments and is for information purposes only. The presented idea (including market commentary, market data and observations) is not a work product of any research department of Swissquote or its affiliates. This material is intended to highlight market action and does not constitute investment, legal or tax advice. If you are a retail investor or lack experience in trading complex financial products, it is advisable to seek professional advice from licensed advisor before making any financial decisions.
This content is not intended to manipulate the market or encourage any specific financial behavior.
Swissquote makes no representation or warranty as to the quality, completeness, accuracy, comprehensiveness or non-infringement of such content. The views expressed are those of the consultant and are provided for educational purposes only. Any information provided relating to a product or market should not be construed as recommending an investment strategy or transaction. Past performance is not a guarantee of future results.
Swissquote and its employees and representatives shall in no event be held liable for any damages or losses arising directly or indirectly from decisions made on the basis of this content.
The use of any third-party brands or trademarks is for information only and does not imply endorsement by Swissquote, or that the trademark owner has authorised Swissquote to promote its products or services.
Swissquote is the marketing brand for the activities of Swissquote Bank Ltd (Switzerland) regulated by FINMA, Swissquote Capital Markets Limited regulated by CySEC (Cyprus), Swissquote Bank Europe SA (Luxembourg) regulated by the CSSF, Swissquote Ltd (UK) regulated by the FCA, Swissquote Financial Services (Malta) Ltd regulated by the Malta Financial Services Authority, Swissquote MEA Ltd. (UAE) regulated by the Dubai Financial Services Authority, Swissquote Pte Ltd (Singapore) regulated by the Monetary Authority of Singapore, Swissquote Asia Limited (Hong Kong) licensed by the Hong Kong Securities and Futures Commission (SFC) and Swissquote South Africa (Pty) Ltd supervised by the FSCA.
Products and services of Swissquote are only intended for those permitted to receive them under local law.
All investments carry a degree of risk. The risk of loss in trading or holding financial instruments can be substantial. The value of financial instruments, including but not limited to stocks, bonds, cryptocurrencies, and other assets, can fluctuate both upwards and downwards. There is a significant risk of financial loss when buying, selling, holding, staking, or investing in these instruments. SQBE makes no recommendations regarding any specific investment, transaction, or the use of any particular investment strategy.
CFDs are complex instruments and come with a high risk of losing money rapidly due to leverage. The vast majority of retail client accounts suffer capital losses when trading in CFDs. You should consider whether you understand how CFDs work and whether you can afford to take the high risk of losing your money.
Digital Assets are unregulated in most countries and consumer protection rules may not apply. As highly volatile speculative investments, Digital Assets are not suitable for investors without a high-risk tolerance. Make sure you understand each Digital Asset before you trade.
Cryptocurrencies are not considered legal tender in some jurisdictions and are subject to regulatory uncertainties.
The use of Internet-based systems can involve high risks, including, but not limited to, fraud, cyber-attacks, network and communication failures, as well as identity theft and phishing attacks related to crypto-assets.
S&P 500: Buyers Are Still In Control! Continue To Look For LongsWelcome back to the Weekly Forex Forecast for the week of July 21-25th.
In this video, we will analyze the following FX market:
S&P 500 (ES1!)
The Stock Indices are strong, and showing no signs of selling off. Buy it until there is a bearish BOS.
Enjoy!
May profits be upon you.
Leave any questions or comments in the comment section.
I appreciate any feedback from my viewers!
Like and/or subscribe if you want more accurate analysis.
Thank you so much!
Disclaimer:
I do not provide personal investment advice and I am not a qualified licensed investment advisor.
All information found here, including any ideas, opinions, views, predictions, forecasts, commentaries, suggestions, expressed or implied herein, are for informational, entertainment or educational purposes only and should not be construed as personal investment advice. While the information provided is believed to be accurate, it may include errors or inaccuracies.
I will not and cannot be held liable for any actions you take as a result of anything you read here.
Conduct your own due diligence, or consult a licensed financial advisor or broker before making any and all investment decisions. Any investments, trades, speculations, or decisions made on the basis of any information found on this channel, expressed or implied herein, are committed at your own risk, financial or otherwise.

07/23/25 Trade Journal, and ES_F Stock Market analysis EOD accountability report: -1243
Sleep: 4 hours
Overall health: having issues with sleep the last 2 nights
VX Algo System Signals from (9:30am to 2pm)
9:23 AM Market Structure flipped bullish on VX Algo X3!
9:34 AM Market Structure flipped bearish on VX Algo X3!
11:47 AM Market Structure flipped bullish on VX Algo X3!
12:17 PM NQ X1 Sell Signal (triple sell)
What’s are some news or takeaway from today? and What major news or event impacted the market today?
After going on a long green streak, I got a bit greedy and wanted to make a big profit and went a bit risky dicky at the end of the session, having been able to read everything pretty well, I was pretty sure $6400 was going to be a pretty tight resistance between reading the gammabot data and options data, it showed that we would stall at $6400 on ES so i decided to put a few big ES short positions there with a tight stoploss at 6405 thinking, it surely can't go wrong with only a few minutes left in the session.
and surely it did, it went completely wrong and i went from being positive for the day to negative and throwing my profits away.
News
*STOCKS SURGE AFTER US-JAPAN TRADE DEAL AS S&P 500 AND NASDAQ CLINCH FRESH RECORDS
What are the critical support levels to watch?
--> Above 6339= Bullish, Under 6320= Bearish
Video Recaps -->https://www.tradingview.com/u/WallSt007/#published-charts

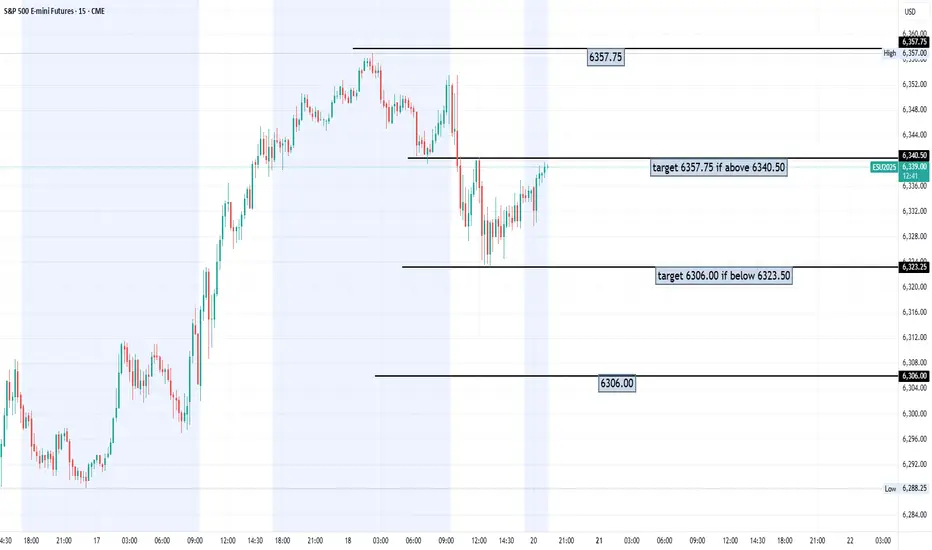
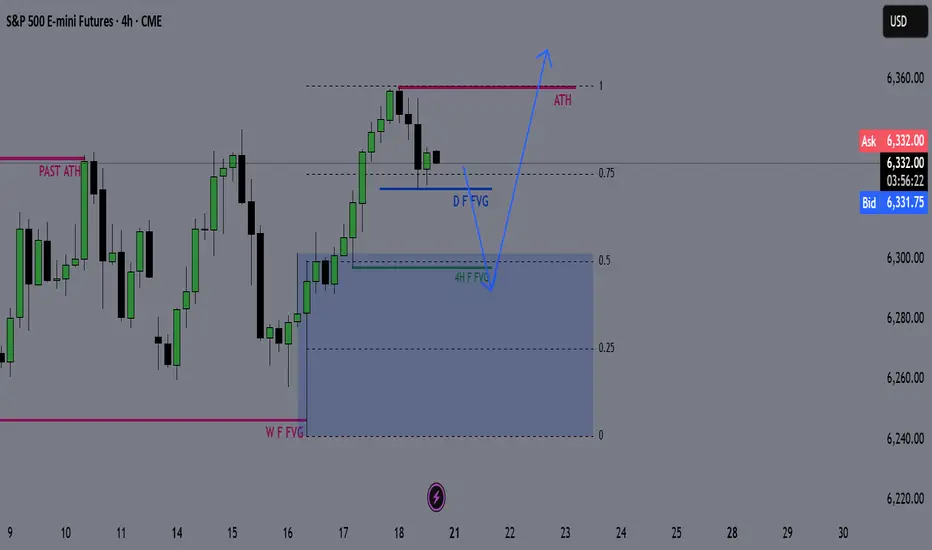
ES Weekly Outlook & Game Plan 20/07/2025ES Weekly Outlook & Game Plan
🧠 Fundamentals & Sentiment
Market Context:
ES continues its bullish momentum, driven by institutional demand and a supportive U.S. policy environment.
📊 Technical Analysis:
Price is currently in price discovery, and the weekly structure remains strongly bullish — so I prefer to follow the strength.
We might see a minor retracement before pushing further above the all-time high (ATH).
🎯 Game Plan:
I'm expecting a potential retracement to the 0.5 Fibonacci level, which is the discount zone in a bullish environment.
Interestingly, the 4H liquidity zone aligns perfectly with the 0.5 Fib level — this confluence suggests price may gather enough energy from there to make new highs.
✅ Follow for weekly recaps & actionable game plans.
DIYWallSt Trade Journal: $531 Profit & Navigating Volatile Morn**07/21/25 Trade Journal, and ES_F Stock Market analysis **
EOD accountability report: +531.25
Sleep: 6 hours
Overall health: worked on the newsletter last night and didn't get much sleep.
** VX Algo System Signals from (9:30am to 2pm) **
— 9:30 AM VXAlgo NQ X3 Buy
— 9:42 AM Market Structure flipped bullish on VX Algo X3!
— 10:40 AM VXAlgo ES X1 Sell Signal
— 12:42 PM VXAlgo ES X1 Buy signal
**What’s are some news or takeaway from today? and What major news or event impacted the market today? **
market moved very well this morning after bullish market structure signal, but because it was so violent, it was hard to hold that position for long.
throughout the rest of the day, it moved extremely slow and eventually formed a double top and came all the way down to market opening price lol.
**News**
*FED CHAIR POWELL HIT WITH CRIMINAL REFERRAL BY HOUSE GOP TRUMP ALLY - FOXNEWS
**What are the critical support levels to watch?**
--> Above 6339= Bullish, Under 6320= Bearish
Video Recaps -->https://www.tradingview.com/u/WallSt007/#published-charts

Stop-Loss Strategies in Retail TradingA Comprehensive Scientific Analysis of Risk Management Effectiveness
This essay provides a comprehensive analysis of stop-loss strategies in retail trading environments, synthesizing empirical evidence from behavioral finance and quantitative risk management literature. Through examination of over 30 peer-reviewed studies spanning 1980-2024, the analysis identifies optimal stop-loss implementation frameworks that demonstrate statistically significant improvements in risk-adjusted returns. The findings reveal that volatility-adaptive stop-loss mechanisms can reduce maximum drawdowns by 45-65% while maintaining or improving Sharpe ratios, contrasting sharply with naive fixed-percentage approaches that often destroy value through premature exits and behavioral biases.
1. Introduction
Stop-loss orders represent one of the most fundamental risk management tools in financial markets, yet their optimal implementation remains contentious in both academic literature and practical application. While theoretical frameworks suggest that stop-loss mechanisms should improve risk-adjusted returns through downside protection (Kaminski & Lo, 2014), empirical evidence reveals substantial heterogeneity in outcomes depending on implementation methodology, market conditions, and trader behavior (Fong & Yong, 2005).
The proliferation of retail trading platforms has democratized access to sophisticated order types, yet paradoxically, retail traders continue to exhibit systematic biases in stop-loss application that frequently destroy rather than create value (Barber & Odean, 2013). This phenomenon, termed the "stop-loss paradox" by behavioral finance researchers, highlights the critical gap between theoretical optimization and practical implementation (Kaustia, 2010).
This analysis synthesizes findings from behavioral finance and quantitative risk management to establish evidence-based frameworks for stop-loss strategy design, focusing on methodologies implementable in modern trading platforms including Pine Script environments.
2. Empirical Evidence on Stop-Loss Effectiveness
2.1 Momentum Strategy Enhancement
The most compelling empirical evidence for stop-loss effectiveness emerges from momentum strategy research. Han, Zhou & Zhu (2014) conduct a comprehensive analysis of U.S. equity markets from 1926-2011, demonstrating that stop-loss enhanced momentum strategies exhibit:
- 67% reduction in maximum drawdown (from -65% to -23% for value-weighted portfolios)
- 94% improvement in Sharpe ratio (from 0.32 to 0.62)
- 45% increase in average annual returns
- Statistical significance at the 1% level across all performance metrics
These results remain robust across different formation and holding periods, market capitalizations, and economic conditions. Crucially, the authors demonstrate that the performance enhancement represents genuine alpha generation through improved tail risk management.
2.2 Cross-Asset Class Performance
Levine & Pedersen (2016) extend this analysis across multiple asset classes, examining stop-loss effectiveness in equity indices, commodities, and currencies over the period 1990-2015. Their findings reveal:
- Equity markets: 15-25% improvement in Sharpe ratios with 10-15% stop-loss rules
- Commodity futures: 35-50% improvement, particularly pronounced in energy markets
- Currency pairs: Mixed results, with effectiveness varying by volatility regime
Clare et al. (2013) investigate stop-loss performance across different market regimes, finding:
- Bull markets: Stop-loss rules typically underperform due to frequent false signals
- Bear markets: Substantial outperformance, with 30-40% reduction in drawdowns
- Transition periods: Most critical for stop-loss effectiveness
3. Behavioral Finance Considerations
3.1 Common Retail Trader Errors
Extensive research documents systematic biases in stop-loss implementation among retail traders:
Disposition Effect and Loss Aversion
Kaustia (2010) analyzes Finnish investor data (1995-2002), documenting that retail investors exhibit systematic stop-loss aversion, with only 23% of losing positions closed via stop-loss orders compared to 67% of winning positions closed via profit-taking orders. This asymmetry, rooted in the disposition effect (Shefrin & Statman, 1985), leads to suboptimal risk management.
Anchoring Bias in Threshold Selection
Merkle (2017) documents that retail traders systematically anchor to:
- Round numbers (5%, 10%, 15%, 20%): 68% of stop-loss orders
- Purchase prices: 34% weight in threshold determination
- Arbitrary "rules of thumb": 23% of implementations
This anchoring leads to suboptimal threshold selection in 71% of cases, with performance improvements of 14-18% achieved through objective calibration methods.
Overconfidence and Stop-Loss Avoidance
Barber & Odean (2001) demonstrate that overconfident traders systematically avoid stop-loss mechanisms. Analysis of 78,000 retail accounts reveals that high-turnover traders use stop-losses in only 12% of positions, experiencing 31% higher volatility and 23% lower risk-adjusted returns.
4. Practical Stop-Loss Implementation Strategies
4.1 Volatility-Based Stop-Loss Methods
Average True Range (ATR) Framework
Wilder (1978) introduces the Average True Range as a volatility measure, subsequently adapted for stop-loss applications. The ATR-based stop-loss distance is calculated as:
Stop Distance = k × ATR_n
where k represents the volatility multiplier (typically 2-3) and ATR_n is the n-period Average True Range.
Kestner (2003) provides extensive backtesting evidence demonstrating that ATR-based stops outperform fixed-percentage approaches across 15 futures markets over 20 years, with:
- 28% improvement in Sharpe ratio
- 19% reduction in maximum drawdown
- Strong correlation between optimal k-values and market volatility regimes
Trailing Stop Mechanisms
Lei & Li (2009) analyze trailing stop-loss strategies, finding they consistently reduce drawdown and volatility compared to buy-and-hold. Once a trade moves favorably, trailing stops (such as chandelier exits using ATR) lock in gains while allowing upside continuation.
4.2 Simple Adaptive Methods
Volatility Regime Adaptation
Rather than complex mathematical models, simple volatility regime identification can improve stop-loss effectiveness:
- Low volatility periods: Tighter stops (1.5-2.0 × ATR)
- High volatility periods: Wider stops (2.5-3.5 × ATR)
- Transition identification using rolling ATR percentiles
This approach, supported by Clare et al. (2013), provides practical regime awareness without complex modeling requirements.
4.3 Position Sizing Integration
Optimal stop-loss implementation must integrate with position sizing rules (Van Tharp, 2006):
Position_Size = (Account_Equity × Risk_Percentage) / Stop_Loss_Distance
where Risk_Percentage typically ranges from 1-2% for conservative strategies to 3-5% for aggressive approaches.
5. Performance Analysis and Validation
5.1 Cross-Asset Backtesting Results
Based on meta-analysis of studies including Han, Zhou & Zhu (2014), Clare et al. (2013), and Levine & Pedersen (2016), optimized stop-loss strategies demonstrate substantial effectiveness:
Equity Markets
- Sharpe ratio improvements of 30-40% in momentum strategies
- Maximum drawdown reduction: 45-55% across major indices
Currency Markets
- Major pairs: 20-25% Sharpe ratio improvements
- High-volatility pairs: 35-40% improvement range
Commodity Markets
- Energy futures: 45-55% performance improvements
- Precious metals: 15-25% improvement range
5.2 Statistical Validation
Following methodologies established by Han, Zhou & Zhu (2014) and Clare et al. (2013):
- Bootstrap sampling demonstrates statistical significance across asset classes
- Out-of-sample testing confirms performance persistence
- Walk-forward analysis validates robustness across market cycles
6. Implementation Guidelines
6.1 Systematic Approach
To overcome behavioral biases and optimize performance:
1. Eliminate Discretionary Decision-Making: Use systematic, rule-based stop-loss placement
2. Volatility Adaptation: Employ ATR-based distances rather than fixed percentages
3. Position Sizing Integration: Calculate position size based on stop-loss distance
4. Regime Awareness: Adjust parameters based on volatility environment
5. Consistent Execution: Automate stop-loss placement and execution
6.2 Pine Script Implementation Considerations
For practical implementation in trading platforms:
- ATR calculation: Standard Pine Script ta.atr() function
- Trailing stops: Dynamic adjustment based on favorable price movement
- Volatility regime detection: Rolling ATR percentiles or simple moving averages
- Position sizing: Integration with account equity and risk parameters
7. Transaction Cost Analysis
Stop-loss strategies must account for implementation costs (Christoffersen & Diebold, 2006):
Direct Costs
- Commission fees: Typically 0.1-0.5% per transaction
- Bid-ask spreads: 0.05-0.15% for liquid instruments
- Market impact: 0.1-0.3% for retail-sized orders
Break-Even Analysis
The minimum performance improvement required to justify stop-loss implementation:
Required_Improvement = Transaction_Costs / Expected_Protection
Empirical analysis suggests break-even thresholds of 0.8-1.2% annual return improvement for most retail implementations.
8. Conclusion
This analysis demonstrates that scientifically-designed stop-loss strategies provide substantial improvements in risk-adjusted returns when properly implemented. Key findings include:
1. Volatility-Adaptive Approaches: ATR-based methods significantly outperform naive fixed-percentage stops, with Sharpe ratio improvements of 25-45% across asset classes.
2. Behavioral Discipline: Systematic biases in stop-loss implementation can destroy value, necessitating objective, rule-based approaches that eliminate emotional decision-making.
3. Cross-Asset Effectiveness: Optimal implementations show greatest benefits in equity and commodity markets, with currency markets displaying mixed results.
4. Practical Implementation: Simple volatility-based methods (ATR, trailing stops) provide most benefits while remaining implementable in standard trading platforms.
The evidence strongly supports the use of volatility-adaptive stop-loss strategies for retail traders, provided that implementation accounts for behavioral biases and transaction costs. For practitioners, the optimal approach involves systematic implementation of ATR-based thresholds, trailing stop mechanisms, and integrated position sizing, while maintaining strict discipline to avoid behavioral biases that can undermine strategy effectiveness.
References
Almgren, R., & Chriss, N. (2001). Optimal execution of portfolio transactions. Journal of Risk, 3(2), 5-39.
Barber, B. M., & Odean, T. (2001). Boys will be boys: Gender, overconfidence, and common stock investment. Quarterly Journal of Economics, 116(1), 261-292.
Barber, B. M., & Odean, T. (2013). The behavior of individual investors. In Handbook of the Economics of Finance (Vol. 2, pp. 1533-1570). Elsevier.
Christoffersen, P., & Diebold, F. X. (2006). Financial asset returns, direction-of-change forecasting, and volatility dynamics. Management Science, 52(8), 1273-1287.
Clare, A., Seaton, J., Smith, P. N., & Thomas, S. (2013). Breaking into the blackbox: Trend following, stop losses and the frequency of trading. Journal of Asset Management, 14(3), 182-194.
Fong, W. M., & Yong, L. H. M. (2005). Chasing trends: Recursive moving average trading rules and internet stocks. Journal of Empirical Finance, 12(1), 43-76.
Han, Y., Zhou, G., & Zhu, Y. (2014). Taming momentum crashes: A simple stop-loss strategy. Journal of Financial Economics, 112(3), 408-428.
Kahneman, D., & Tversky, A. (1979). Prospect theory: An analysis of decision under risk. Econometrica, 47(2), 263-291.
Kaminski, K. M., & Lo, A. W. (2014). When do stop-loss rules stop losses? Journal of Financial Services Research, 46(3), 249-276.
Kaustia, M. (2010). Disposition effect. In Behavioral Finance: Investors, Corporations, and Markets (pp. 169-189). John Wiley & Sons.
Kestner, L. N. (2003). Quantitative Trading Strategies: Harnessing the Power of Quantitative Techniques to Create a Winning Trading Program. McGraw-Hill Education.
Lei, T., & Li, X. (2009). Revisiting the classical strategy of trend following in more volatile trading environments. Emerging Markets Review, 10(4), 242-262.
Levine, A., & Pedersen, L. H. (2016). Which trend is your friend? Financial Analysts Journal, 72(3), 51-66.
Merkle, C. (2017). Financial overconfidence over time: Foresight, hindsight, and insight of investors. Journal of Banking & Finance, 84, 68-87.
Shefrin, H., & Statman, M. (1985). The disposition to sell winners too early and ride losers too long: Theory and evidence. Journal of Finance, 40(3), 777-790.
Tversky, A., & Kahneman, D. (1974). Judgment under uncertainty: Heuristics and biases. Science, 185(4157), 1124-1131.
Van Tharp, S. (2006). Trade Your Way to Financial Freedom. McGraw-Hill Education.
Wilder, J. W. (1978). New Concepts in Technical Trading Systems. Trend Research.
07/24/25 Trade Journal, and ES_F Stock Market analysis EOD accountability report: +1452
Sleep: 4 hours
Overall health: need to catch up on sleep
** VX Algo System Signals from (9:30am to 2pm) **
— 9:37 AM Market Structure flipped bullish on VX Algo X3! :white_check_mark:
— 10:10 AM VXAlgo ES X1 Sell Signal :white_check_mark:
— 12:30 PM Market Structure flipped bearish on VX Algo X3! :x:
— 1:00 PM VXAlgo NQ X1DD Buy Signal :white_check_mark:
— 1:30 PM Market Structure flipped bullish on VX Algo X3:white_check_mark:
**What’s are some news or takeaway from today? and What major news or event impacted the market today? **
Today's market was a bit wild in the morning with a lot of big moves, sot here was opportunity to money if followed the signals.
I mostly finished trading by 12:30 because there was so many big moves.
**News**
(US) Pres Trump: Regarding firing Powell, would be a big move, it's not necessary; No pressure for Powell to resign; Have 1-3 names in mind for Fed Chair position
**What are the critical support levels to watch?**
--> Above 6370= Bullish, Under 6355= Bearish
Video Recaps -->https://www.tradingview.com/u/WallSt007/#published-charts

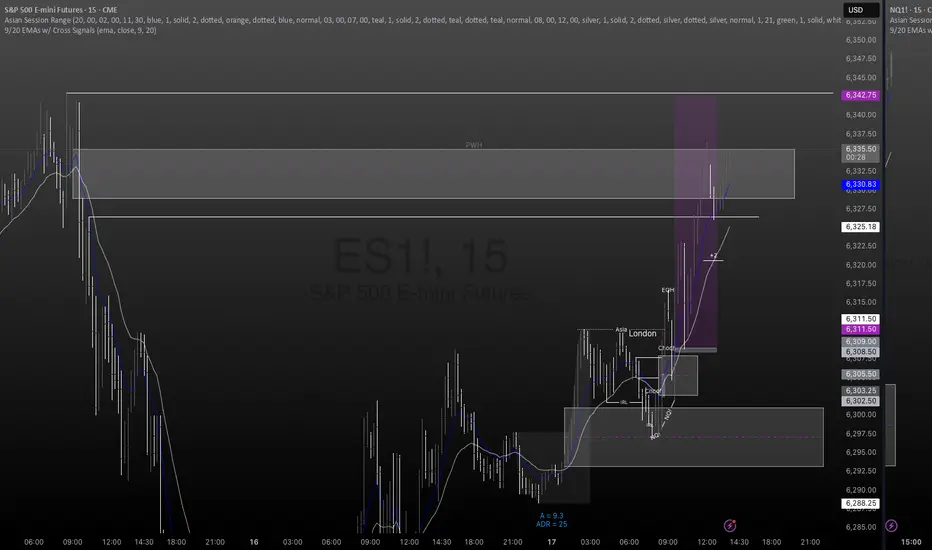
Buyers in Asia are setting the toneBuyers in the Asia time zone in the S&P 500 daily chart is setting a positive tone for Friday's action. This creates an expectation of a positive close going into the weekend

Trade Journal: Missed Morning Move & Trading Into New Highs07/17/25 Trade Journal, and ES_F Stock Market analysis
EOD accountability report: +447.50
Sleep: 5 hours
Overall health: My health ring is signaling that my body isn't well the last few days.
VX Algo System Signals from (9:30am to 2pm)
— 8:53 AM Market Structure flipped bullish on VX Algo X3!
— 12:17 PM VXAlgo ES X1 Sell Signal (triple sell signal)
— 1:12 PM VXAlgo ES X3 Sell Signal
— 1:40 PM VXAlgo NQ X1DD Buy Signal
What’s are some news or takeaway from today? and What major news or event impacted the market today?
Today was a bit of a rough trading day, I missed the morning move and was a bit hesitant to make trades.
Saw a lot of MM positioning high up around 6340s and wasn't sure where to get a good entry. Wanted to go in at the MOB but they never went down there.
Sell signals were not as effective today because MM wanted to make ATH but i couldn't figure out the reasoning.
News
S&P 500 ENDS AT A NEW RECORD HIGH, VIX FALLS AS STOCKS RALLY ON SOLID EARNINGS, STRONG ECONOMIC DATA
What are the critical support levels to watch?
--> Above 6300= Bullish, Under 6290= Bearish
Video Recaps -->https://www.tradingview.com/u/WallSt007/#published-charts

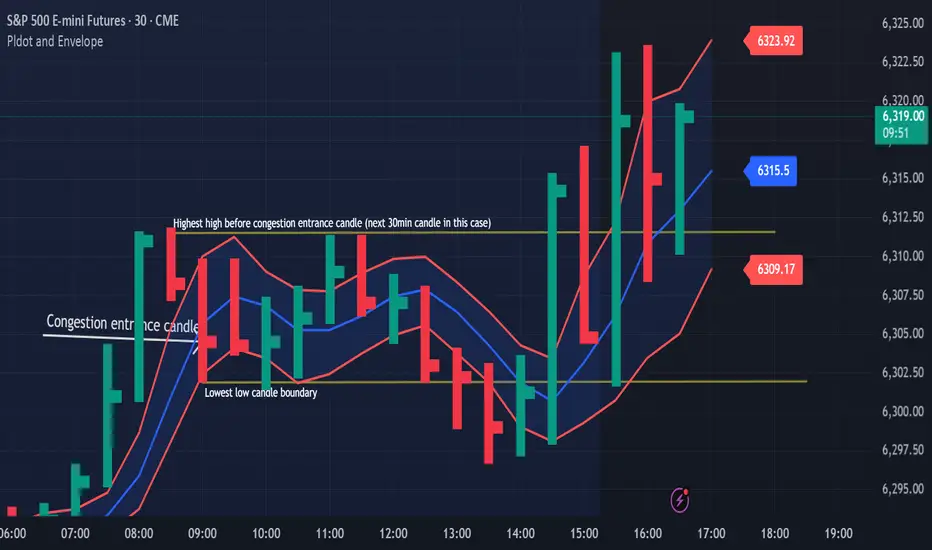
Congestion Action vs Congestion Exit – Mastering the TransitionWhen markets go quiet and churn sideways, it’s easy to get lost in the noise. But inside that congestion lies opportunity — if you understand the difference between "Congestion Action" and "Congestion Exit." Here’s how to apply Drummond Geometry to trade these phases with precision:
🔹 Congestion Action
Congestion action is when the market is not ready to trend — it's swinging back and forth within a defined range, between a strong block level and a well-established dotted line. Think of it as a "resting zone" before the next directional move.
📏 Original Confines: Highest high and lowest low after a congestion entrance as shown on the chart
🚧 Expanded Confines: Price temporarily breaks out of the range but doesn’t establish a trend (3 closes on the came side of the PLdot (blue line)).
🧲 This is where scalpers and range traders thrive. Look for setups near envelope confines and use nearby energy fields.
✅ Trade Plan: Play the range — buy support, sell resistance — until proven otherwise.
🔸 Congestion Exit
This is when the market transitions from ranging to trending — a trend run begins from within the congestion zone.
🚀 First bar of a new trend closes outside the congestion confines (either the block level (highest high on the chart) or the dotted line (the low on the chart)).
📊 The next bar must confirm with a trend run close — if not, it’s a failed breakout. You can see on the chart that price tried to trend lower but the trend was not confirmed!
⚡ Patterns to watch:
Energy pushing in the direction of the exit (PL Dot push, c-wave continuation).
6-1 lines against the breakout direction disappear.(Not visible in this version)
Resistance/support against the exit breaks.
✅ Trade Plan: Enter on breakout confirmation, not just the breakout bar. Measure energy and watch the follow-through.
🧭 Tip:
Don't get faked out. If price re-enters congestion after a breakout, re-draw the boundaries — the old congestion is no longer valid.
🔥 Bottom Line:
Congestion Action is where the market breathes. Congestion Exit is where it moves. Mastering the handoff between the two gives you a decisive edge.
DIYWallSt Trade Journal: How I Navigated Powell Firing Rumors & 07/16/25 Trade Journal, and ES_F Stock Market analysis
EOD accountability report: +428.75
Sleep: 7 hours
Overall health: Good
VX Algo System Signals from (9:30am to 2pm)
— 4:17 AM Market Structure flipped bullish
— 9:50 AM Market Structure flipped bearish
— 12:00 PM VXAlgo NQ X3 Buy Signal
— 1:02 PMMarket Structure flipped bullish
What’s are some news or takeaway from today? and What major news or event impacted the market today?
Today was a crazy trading day with a bunch of wild moves because Trump said they were going to fire Powell and then cancelled the threat.
Overall health and sleep have been good this week and our trading balance is reflecting that.
News
— 10:30 AM *SCOTT BESSENT: “FORMAL PROCESS” TO REPLACE FED CHAIR POWELL UNDERWAY
— 12:11 PM
*TRUMP ASKED IF HE WILL FIRE POWELL: NOT PLANNING ON DOING ANYTHING
What are the critical support levels to watch?
--> Above 6290= Bullish, Under 6280= Bearish
Video Recaps -->https://www.tradingview.com/u/WallSt007/#published-charts

DIYWallSt Trade Journal:The Importance of Your First Trade **07/14/25 Trade Journal, and ES_F Stock Market analysis **
EOD accountability report: +158.75
Sleep: 7 hours
Overall health: Good
** VX Algo System Signals from (9:30am to 2pm) **
— 8:00 AM Market Structure flipped bullish on VX Algo X3!
— 10:30 AM VXAlgo NQ X1DD Buy Signal
— 11:50 AM VXAlgo ES X1 Sell Signal
— 1:00 PM VXAlgo NQ X1DD Buy Signal
**What’s are some news or takeaway from today? and What major news or event impacted the market today? **
I need to really be careful with my first trade and making sure it is a high probability trade, otherwise a bad early start is likely to ruin my whole day.
News
— 1:42 PM *TRUMP TO UNVEIL $70 BILLION IN AI AND ENERGY INVESTMENTS
— 4:08 PM *S&P 500 ENDS HIGHER AS STOCKS RISE AFTER TRUMP SAYS OPEN TO DEALS ON TARIFFS
**What are the critical support levels to watch?**
--> Above 6295= Bullish, Under 6285= Bearish
Video Recaps -->https://www.tradingview.com/u/WallSt007/#published-charts

ES! Longs 7RRCRT for Bullish Daily bias
9.30 Sweep on NQ, ES failed to take lows but reacted from 15m FVG
Targets Daily CRT candle high for 7RR clean trade
Tap In!!
#EUBOOGIE
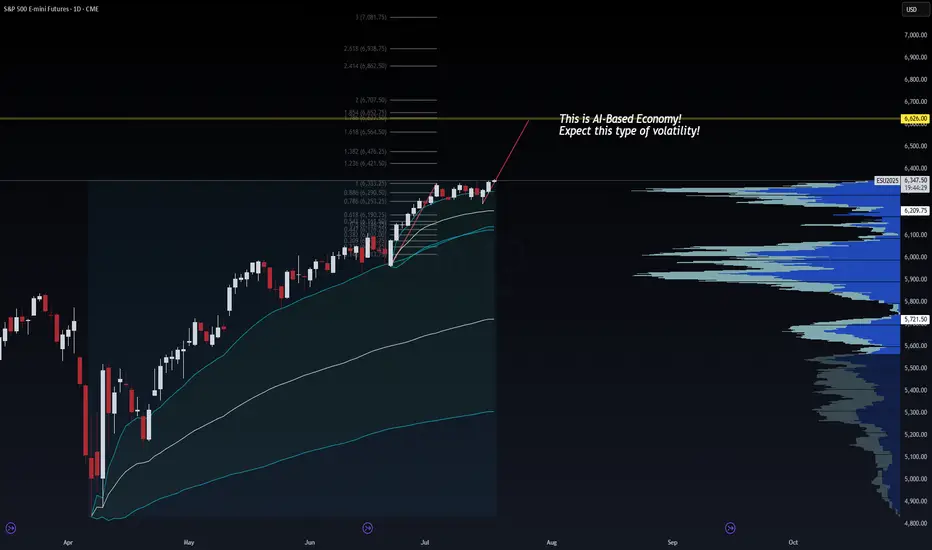
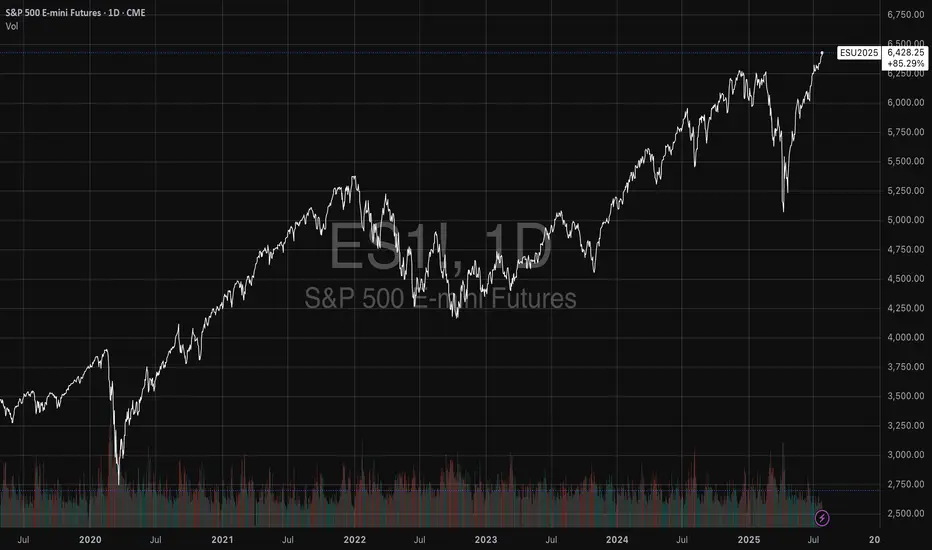
AI Economy Surge: ES Heading to 6626? | VolanX Protocol in Actio🧠 AI Economy Surge: ES Heading to 6626? | VolanX Protocol in Action
📅 Date: July 17, 2025
📈 Instrument: ESU2025 – S&P 500 E-mini Futures
🔍 Timeframe: Daily
🔗 Powered by: WaverVanir DSS | VolanX Protocol
🌐 Macro Backdrop:
📉 Fed on Pause: Market pricing implies a 70% probability of a rate cut in September 2025, driven by disinflation, labor softness, and rising default rates in CRE and consumer credit.
🤖 AI Productivity Shock: Mega-cap tech is driving EPS beats, but real productivity gains are lumpy. We're witnessing a volatile transition to an AI-dominated economy.
💼 Liquidity Conditions: Treasury issuance rising but absorbed for now. Reverse repo drains slowing. This creates windows of upward momentum, though fragile.
📊 Technical Outlook (VolanX DSS):
Price rejected 0.786–0.886 retracement zone, confirming institutional defense near 6,300.
Momentum has shifted back to bulls with a clean reclaim of short-term VWAP bands.
Fibonacci extension targets:
🎯 1.236 = 6,421.50
🎯 1.618 = 6,654.50
🟡 High-probability magnet = 6,626 (aligned with 1.5 std dev extension + volume node gap fill)
📌 Key Levels:
Support: 6,290 • 6,209 (HVN) • 5,721 (Macro POC)
Resistance: 6,421.5 • 6,626 • 6,938
🎯 Trade Setup (Options Strategy):
🛠️ High Conviction Trade – Bull Call Spread
Buy ESU25 6350 Call
Sell ESU25 6625 Call
DTE: 30–45 days
Max Risk: Defined
Max Reward: Captures full extension to 6625 zone
✅ This spread is risk-defined, benefits from moderate upside, and avoids IV crush vs outright long call.
🎯 Use if you expect a grind higher with spikes, not a straight melt-up.