This is a focus the Index marketIt's Sunday and you might want to look at the S&P when the Market opens later tonight. For 2 days the S&P went lower and I think you can categorize this as an expanding Market and it's very tradable. You can even miss the trade on Thursday and still make a good return on Friday. Also I would call th
Related futures

Nasdaq’s All Time HighsLiquidity moves liquidity.
Expansion, Retracement, Reversal, Consolidation
Market is doing 1 of these 4
Expansion is determined by where liquidity sits and where it is going. Price delivery is upmost important when receiving bias and narrative
Seeing where price is coming from is just as importan
SPY The Final Countdown Since the April lows, equity markets have exhibited strong performance, with many stocks appreciating by nearly 100%—some even exceeding that threshold. Given the velocity of this rally, a corrective pullback may be imminent before the broader uptrend resumes.
The current reading on the Fear & Gree
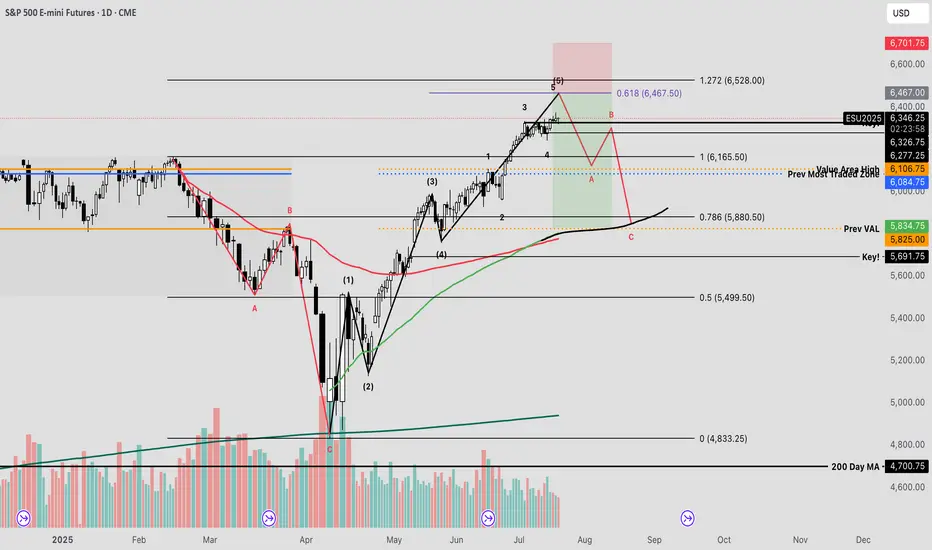
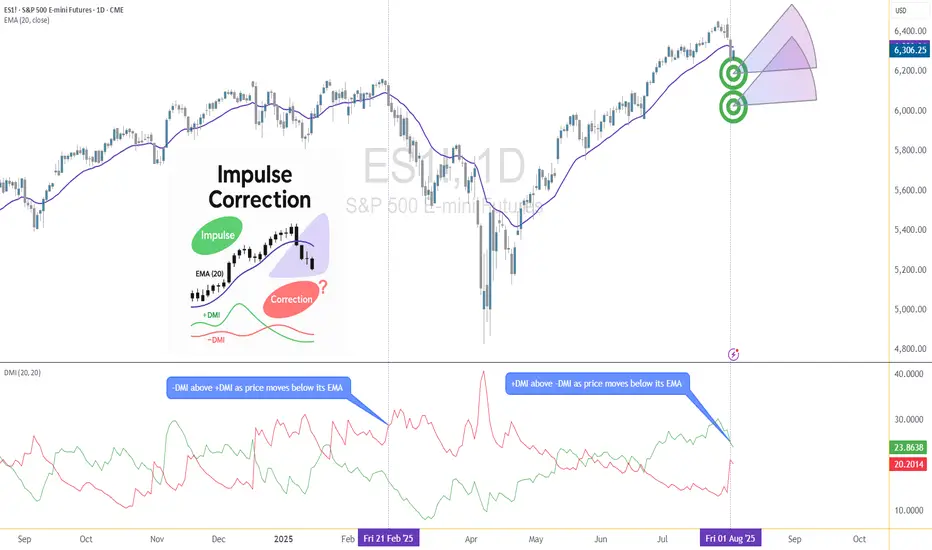
Corrective Dip or New Downtrend on the S&P 500 Futures?🟣 1. Impulses vs. Corrections – The Classical View
When price trends, it doesn't move in a straight line. Instead, it alternates between directional movements called impulses and counter-directional pauses or retracements known as corrections. Most analysts define an impulse as a sharp, dominant m
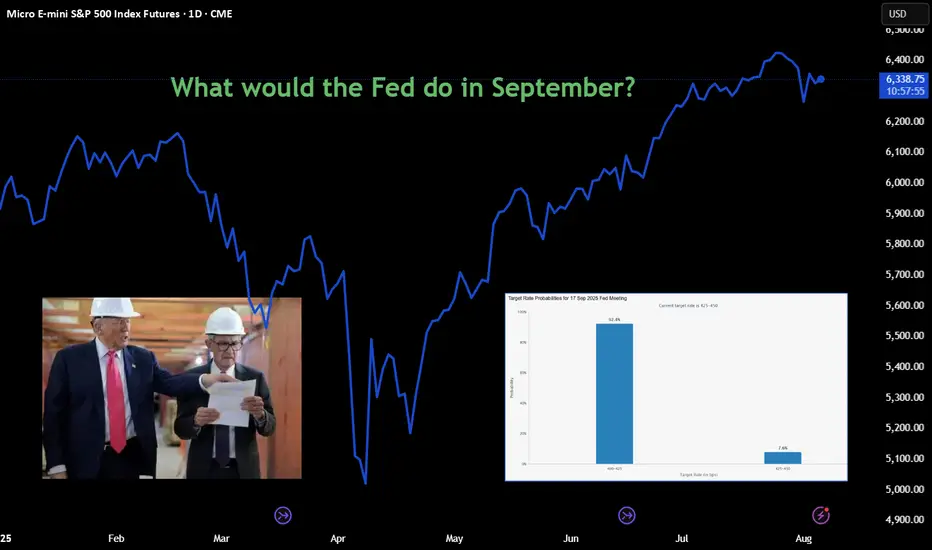
Approachable Contracts for Trading Around Fed DecisionsCME Group E-Mini S&P Options ( CME_MINI:ES1! ) and Micro S&P Futures ( CME_MINI:MES1! ), #microfutures
On July 30th, the Federal Open Market Committee (FOMC) decided to keep the Fed Funds rate unchanged at the 4.25-4.50% target range. Investors now turn their focus on whether the Fed will cut rates
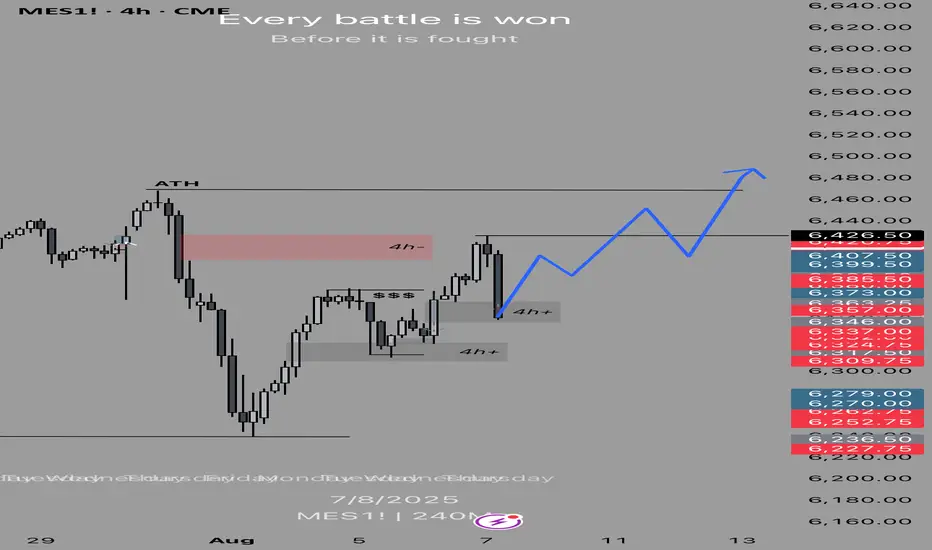
ES bearish sentiment for Monday aug 4thIll be watching for a bearish set up to form around the bearish 4 hr fvg to take out previous month low
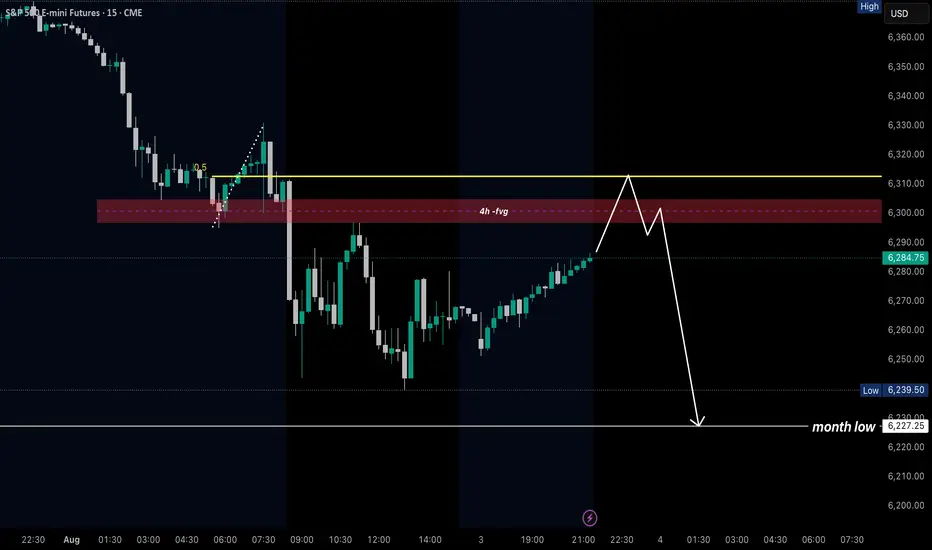
Time to catch its breathAfter the break to lower prices in the daily S&P 500 chart, the expectation for Monday is for the market to stop and catch its breath which means are not looking for a big day down on Monday but rather a sideways so only slightly lower move without new fundamental information to stimulate the market

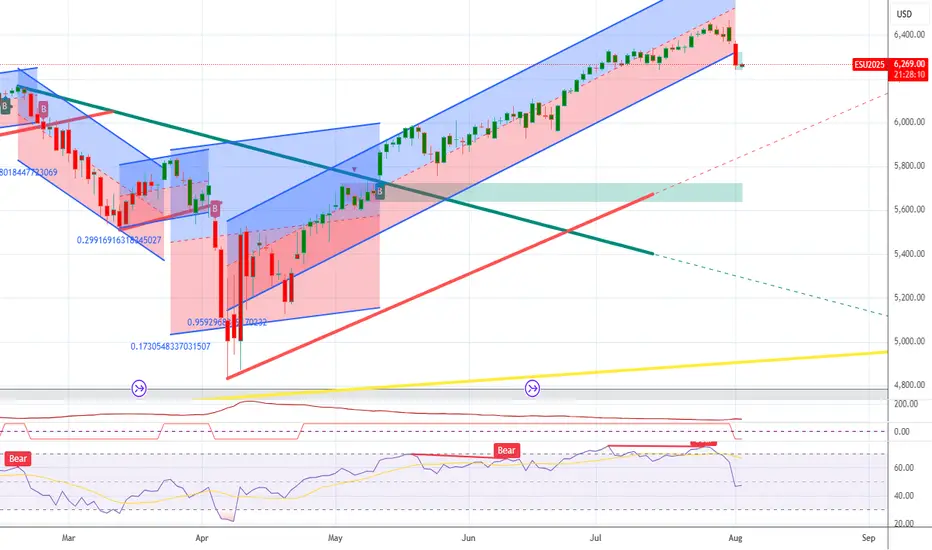
SP500 ShortSP500 is now net short on the regression break.
I am short the Russell2000 from last week and I am considering this trade into Summer.
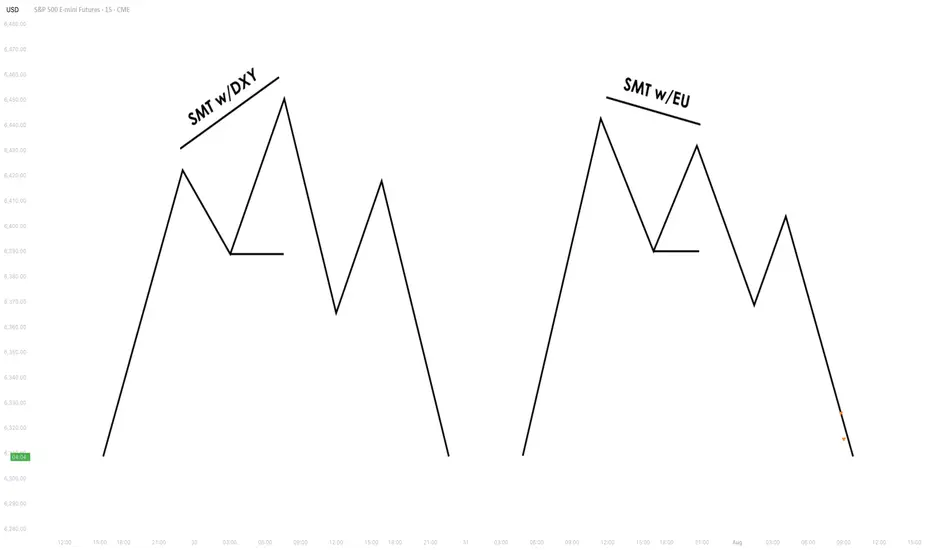
Understanding SMT Divergence In Trading1. Definition and Importance
SMT (Smart Money Technique) Divergence refers to a trading concept that involves identifying discrepancies between the price movement of correlated markets or instruments.
These discrepancies can signal potential market reversals or price manipulation. Specifically, it
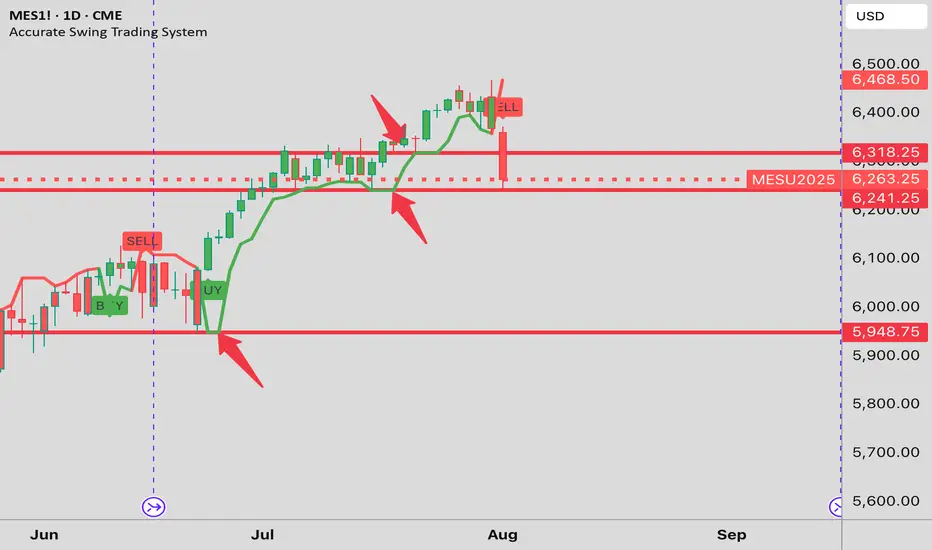
Friday's support clearly shown This is why I use the Accurate Swing Trading System (Ceyhun). Look at it in default configuration on this daily MES1! chart. I drew the red horizontal lines where the indicator line is "flat". That is what I am trying to show you. An "Emergent Quality" of the indicator. I note the line at 6,241
See all ideas
Summarizing what the indicators are suggesting.
Neutral
SellBuy
Strong sellStrong buy
Strong sellSellNeutralBuyStrong buy
Neutral
SellBuy
Strong sellStrong buy
Strong sellSellNeutralBuyStrong buy
Neutral
SellBuy
Strong sellStrong buy
Strong sellSellNeutralBuyStrong buy
A representation of what an asset is worth today and what the market thinks it will be worth in the future.
Displays a symbol's price movements over previous years to identify recurring trends.
Frequently Asked Questions
The current price of Micro E-mini S&P 500 Index Futures (Mar 2026) is 6,500.50 USD — it has risen 0.38% in the past 24 hours. Watch Micro E-mini S&P 500 Index Futures (Mar 2026) price in more detail on the chart.
The volume of Micro E-mini S&P 500 Index Futures (Mar 2026) is 1.00. Track more important stats on the Micro E-mini S&P 500 Index Futures (Mar 2026) chart.
The nearest expiration date for Micro E-mini S&P 500 Index Futures (Mar 2026) is Mar 20, 2026.
Traders prefer to sell futures contracts when they've already made money on the investment, but still have plenty of time left before the expiration date. Thus, many consider it a good option to sell Micro E-mini S&P 500 Index Futures (Mar 2026) before Mar 20, 2026.
Open interest is the number of contracts held by traders in active positions — they're not closed or expired. For Micro E-mini S&P 500 Index Futures (Mar 2026) this number is 1.54 K. You can use it to track a prevailing market trend and adjust your own strategy: declining open interest for Micro E-mini S&P 500 Index Futures (Mar 2026) shows that traders are closing their positions, which means a weakening trend.
Buying or selling futures contracts depends on many factors: season, underlying commodity, your own trading strategy. So mostly it's up to you, but if you look for some certain calculations to take into account, you can study technical analysis for Micro E-mini S&P 500 Index Futures (Mar 2026). Today its technical rating is strong buy, but remember that market conditions change all the time, so it's always crucial to do your own research. See more of Micro E-mini S&P 500 Index Futures (Mar 2026) technicals for a more comprehensive analysis.