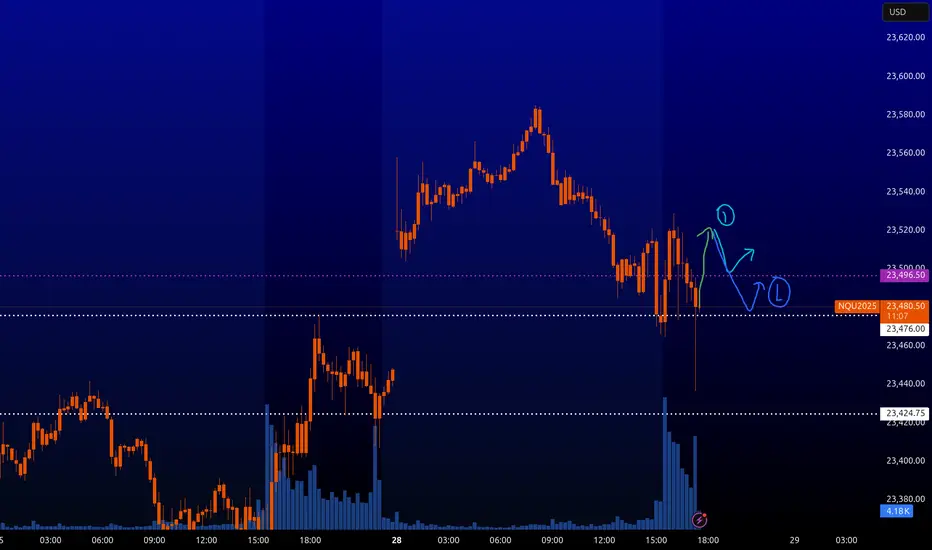
NQ : Scalping levelsA rebound from the level with the arrow can be expected.
During volatile news, it is not recommended to trade when the market is closed. However, it will continue to operate for the time being.
MNQ1! trade ideas

Why Are Markets Rising Despite the Tariffs?Because of the
1) Set timeline on finalizing the tariff rates and
2) The ongoing negotiations,
They aimed at striking a balanced deal between the U.S. and its trading partners.
The Liberation Day tariffs were announced on 2nd April, and markets initially crashed in response. However, just seven days later, on 9th April, the U.S. postponed the higher tariff increases for most countries by 90 days. Since then, markets have rebounded and even broken above their all-time highs set in December last year.
Now that the dust is settling with the expiration of timeline and ongoing negotiations, the big question is:
Where will the markets head next?
Mirco Nasdaq Futures and Options
Ticker: MNQ
Minimum fluctuation:
0.25 index points = $0.50
Disclaimer:
• What presented here is not a recommendation, please consult your licensed broker.
• Our mission is to create lateral thinking skills for every investor and trader, knowing when to take a calculated risk with market uncertainty and a bolder risk when opportunity arises.
CME Real-time Market Data help identify trading set-ups in real-time and express my market views. If you have futures in your trading portfolio, you can check out on CME Group data plans available that suit your trading needs www.tradingview.com

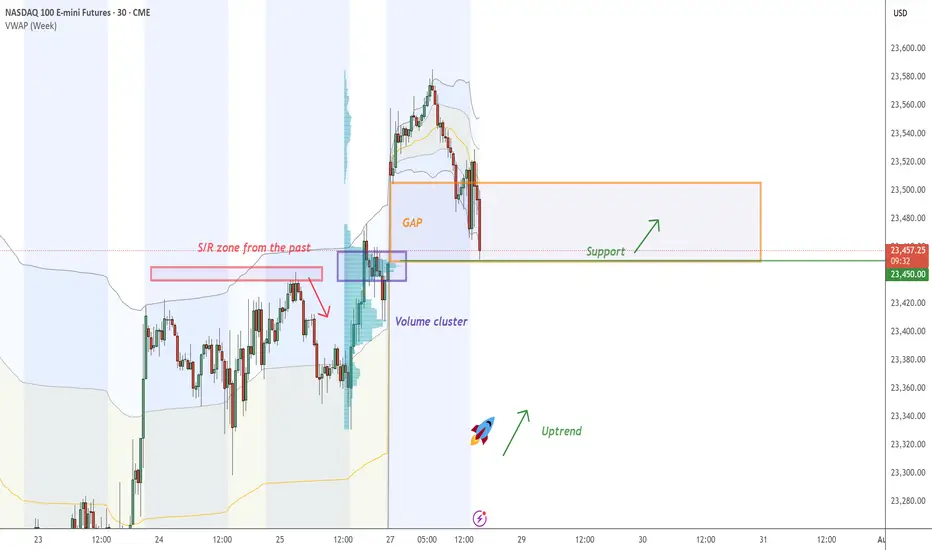
NASDAQ - Fair Value GAP On NASDAQ , it's nice to see a strong buying reaction at the price of 23450.00.
There's a significant accumulation of contracts in this area, indicating strong buyer interest. I believe that buyers who entered at this level will defend their long positions. If the price returns to this area, strong buyers will likely push the market up again.
(FVG) - Fair Value GAP and high volume cluster are the main reasons for my decision to go long on this trade.
Happy trading
Dale
SP500 & Nasdaq Daily Trade SetupsIn this update we review the recent price action in the E-mini SP500 & Nasdaq futures contracts and identify the next high-probability trade setups and price objectives to target. To review today's video analysis, click here!

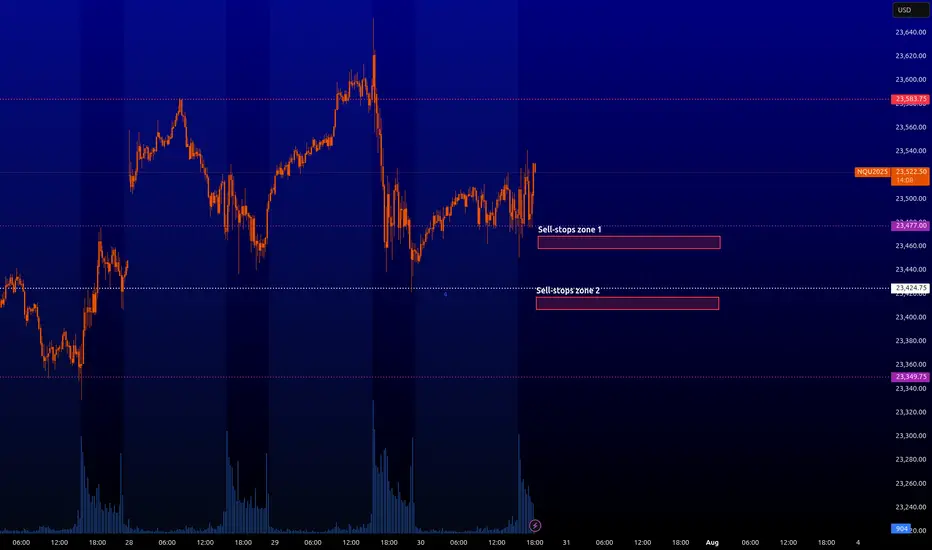
NQ : enormous amount of sell-stopsI have highlighted two zones where a lot of sell-stop orders are currently concentrated. Those who trade robots with fast buybacks, you can put your algorithms there. When entering these zones there will be a quick dropdown of the price if it comes to these zones in liquid time (American session).
Those who do not have robots, I will inform you when it will be possible to get some profit from these zones with limit trades.
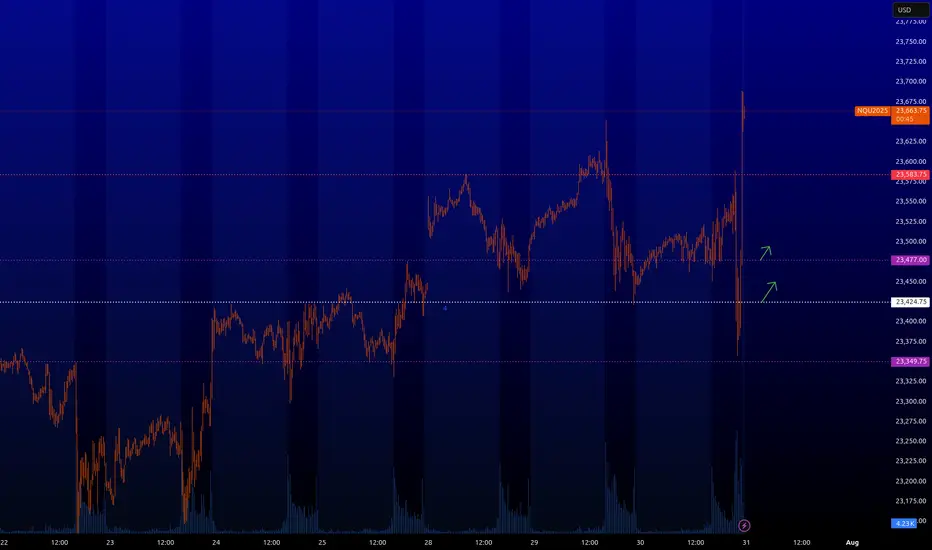
NQ : Buy levelsAll right, the stops are off like I said in my prev NQ post.
Turns out there was an important FOMC news that I didn't notice. I don't usually trade on the news.
Now the levels where the green arrows are from are back in play. You can pips, you can scalp, you can look for longer trades from them. I usually scalp them.
Lord Jesus Christ, Son of God, have mercy on us sinnersare you ready... ?
In the name of the Father, and of the Son, and of the Holy Spirit. Amen.
Glory to Thee, our God, glory to Thee.
O Heavenly King, O Comforter, the Spirit of Truth, who art in all places and fillest all things; Treasury of good things and Giver of life, come and dwell in us and cleanse us from every stain, and save our souls, O gracious Lord.
Holy God, Holy Mighty, Holy Immortal, have mercy on us.
Glory to the Father, and to the Son, and to the Holy Spirit: now and ever and unto ages of ages. Amen.
All-holy Trinity, have mercy on us. Lord, cleanse us from our sins. Master, pardon our iniquities. Holy God, visit and heal our infirmities for Thy name's sake.
Lord, have mercy.
Glory to the Father, and to the Son, and to the Holy Spirit: now and ever and unto ages of ages. Amen.
Our Father, who art in the heavens, hallowed be Thy name: Thy kingdom come; Thy will be done on earth, as it is in heaven. Give us this day our daily bread; and forgive us our trespasses, as we forgive those who trespass against us; and lead us not into temptation, but deliver us from the evil one.
For Thine is the kingdom, and the power, and the glory, of the Father, and of the Son, and of the Holy Spirit: now and ever and unto ages of ages. Amen.
In one, holy, catholic, and apostolic Church

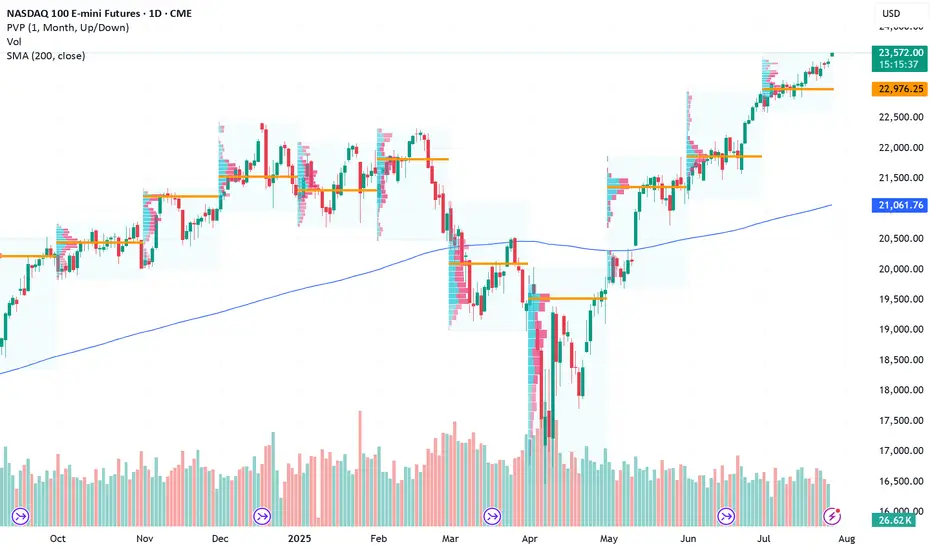
Bias is still Bullish However its month end Overall bias is still strong bullish, do note that its coming to end of month, either we pull back a bit or continues higher till end of month then pullback. Losing 23350 and 23300, probabilities of moving lower will higher since we had short squeeze move last Friday. Max Pain is 23020 can be use as a guide off futures movement.
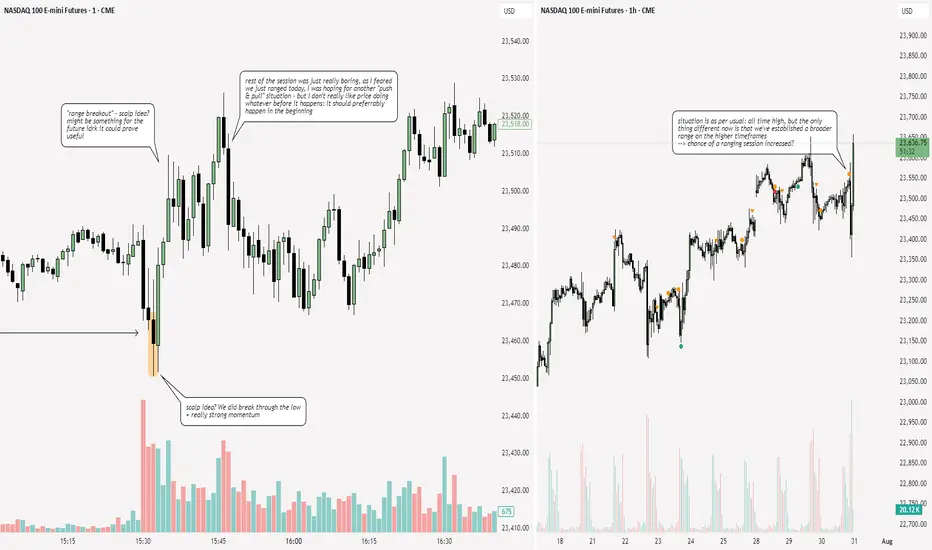
NQ: 227th trading session - recapNot a good session today - I was so distracted + the price action was just awful. Stuff happens ig
Tuesday Long Trade for the NASDAQ 7/29I'm feeling ultra bullish on NQ right now. Ideally, I want to see price carve out an inverse head and shoulders or a double bottom—either could serve as a springboard to new highs. I took two longs this morning and captured solid gains off the weekly opening gap. Would love to see one final wick into that zone before we blast off.
Long Entry:23,476.75
Target: Break of the Highs | Trailing SL
Today's trades:

Approach Next Resistance Amid Cautious OptimismCurrent Price: 23272.25
Direction: LONG
Targets:
- T1 = 23480
- T2 = 23720
Stop Levels:
- S1 = 22990
- S2 = 22770
**Wisdom of Professional Traders:**
This analysis synthesizes insights from thousands of professional traders and market experts, leveraging collective intelligence to identify high-probability trade setups. The wisdom of crowds principle suggests that aggregated market perspectives from experienced professionals often outperform individual forecasts, reducing cognitive biases and highlighting consensus opportunities in NASDAQ Futures.
**Key Insights:**
NASDAQ Futures exhibit strong recovery potential but face technical resistance at $23420. The market momentum suggests short-term bullishness despite concerns about seasonal reversals in late August to October. Traders are advised to focus on breakout scenarios while employing risk mitigation strategies including hedges.
**Recent Performance:**
Over the past six months, NASDAQ Futures have displayed substantial volatility. After a steep drop of 27%, the index staged an impressive 40% recovery. Such swings highlight heightened risk yet underscore resilience, bolstered by strong inflows into technology stocks.
**Expert Analysis:**
Analysts caution against overcrowded positions in mega-cap tech stocks dominating NASDAQ Futures. While the rally has offered compelling returns, seasonal risks suggest potential reversals during late summer and early autumn. Diversification strategies into less-crowded sectors may enhance portfolio robustness.
**News Impact:**
Recent announcements around AI adoption, earnings beats by key technology firms, and federal monetary policy stabilization have bolstered sentiment in tech-heavy indices, including NASDAQ Futures. Continued interest in growth stocks adds fuel to the bullish narrative despite looming risk factors.
**Trading Recommendation:**
Traders should consider a LONG position based on strong bullish sentiment and favorable technical setups. However, risk factors such as seasonal reversals and crowded trades in large-cap technology stocks require prudent stop levels and diversification strategies to protect against downside vulnerabilities.
NASDAQ (Nas 100): Buyers Are In Control. Wait For LongsWelcome back to the Weekly Forex Forecast for the week of July 28 - Aug 1st.
In this video, we will analyze the following FX market:
NASDAQ (NQ1!) NAS100
The Nasdaq rose Friday to fresh highs, following a busy week of tariff updates and earnings. The index is showing no signs of bearishness.
Wait for pullbacks to FVGs to buys.
FOMC and NFP warrant caution with new entries. Wait until the news before new entries.
Enjoy!
May profits be upon you.
Leave any questions or comments in the comment section.
I appreciate any feedback from my viewers!
Like and/or subscribe if you want more accurate analysis.
Thank you so much!
Disclaimer:
I do not provide personal investment advice and I am not a qualified licensed investment advisor.
All information found here, including any ideas, opinions, views, predictions, forecasts, commentaries, suggestions, expressed or implied herein, are for informational, entertainment or educational purposes only and should not be construed as personal investment advice. While the information provided is believed to be accurate, it may include errors or inaccuracies.
I will not and cannot be held liable for any actions you take as a result of anything you read here.
Conduct your own due diligence, or consult a licensed financial advisor or broker before making any and all investment decisions. Any investments, trades, speculations, or decisions made on the basis of any information found on this channel, expressed or implied herein, are committed at your own risk, financial or otherwise.

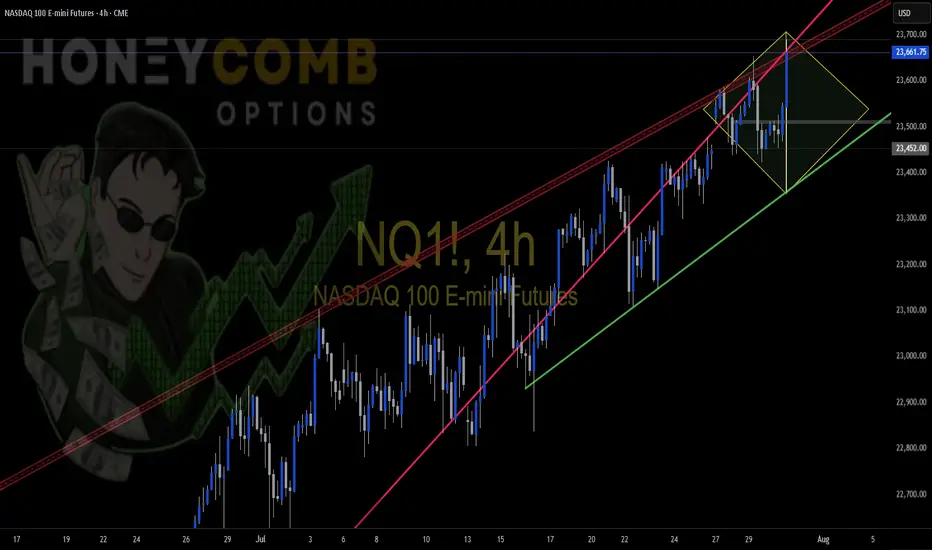
NQ Possible Diamond Top FormationPossible Diamond Top formation. This is a long play, and it may not be completed. I just wanted to show everyone what I see. Trade Safe
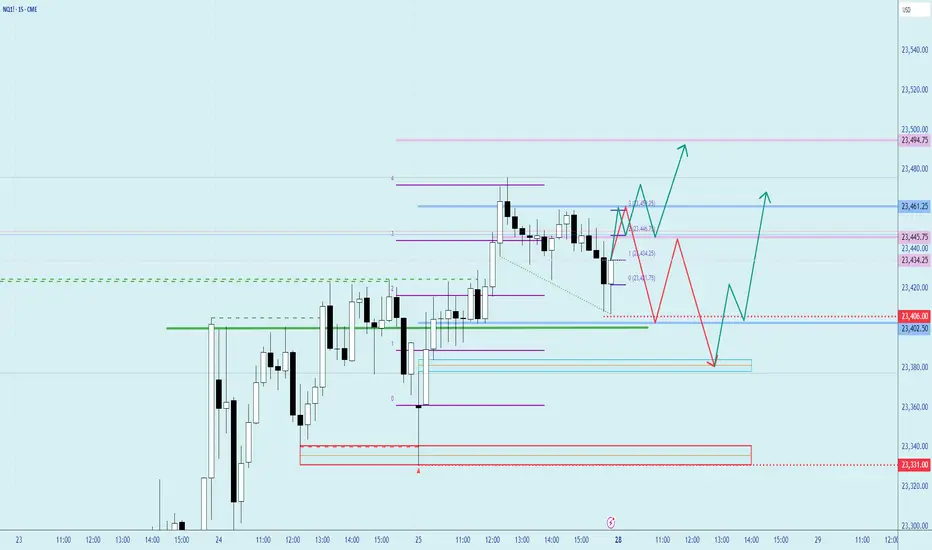
NQ : Scalping levelsHere's a very likely scenario on the NQ trade. Once the price grows back, you can take short pullbacks from these levels.
Be careful on trading on the news. It is better not to trade in them. Also, the levels are unlikely to work in illiquid times.
I will post the results of the levels and my trades in the comments if everything will be according to the scenario.
NQ & ES Technical AnalysisGood evening my friends... This is my first time posting something on this platform. I decided to share my analysis on NQ & ES here with you, but without sharing strategies, rules and entry techniques. Only the key levels and scenarios... I will make one or two comments every day... I am very happy to share my ideas with you!!!

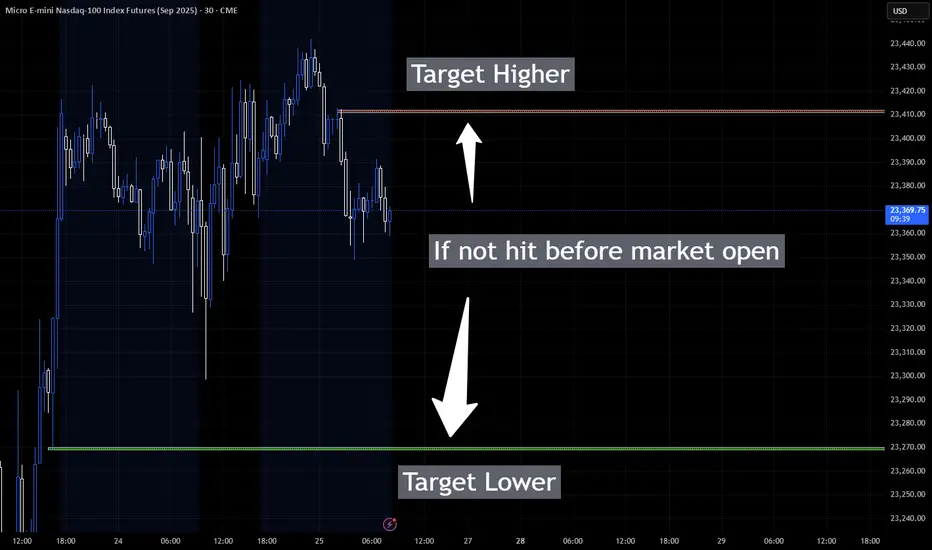
US Market open Targets for NQTarget areas for NQ at US Market open. I will use lower timeframe signals to watch for move up to higher target area or Down to lower target.
Mastering One Good Trade for New York Session📍 Trade Overview
Asset: Nasdaq 100 E-Mini Futures
Direction: Short
Entry Price : 23607.0
Exit Price : 23512.85
Date of Trade : 08/07/2025
R:R Target : 5.26
Result: Win
Timeframe: 15min
🧠 Trade Thesis
Behavior of price was the key to this trade around the specific time of New York open along with sweeping the London high combined with an ADR pivot level and a rise in Asian and London for the reversal in New York.
📊 Technical Breakdown
Structure: (M formation, False Breakout, double top)
Key Levels: (HOD supply/demand, pushed above London high, directly at ADR Pivot Level)
Indicators (if any): (e.g., TDI, EMA confluence, RSI divergence)
Volume Behavior: (3 pushes into the high for NY open, stop hunt, bearish engulfing on the 15 and 5 minute)
⏱️ Timing
Session: NYC
Minute of Entry: Early in the session / 10:10amEST
Context in Session: Breakout window, equities hour
🧩 Execution Details
Entry Trigger: (Candle close confirmation with a bearish engulfing)
Stop Loss Location: (Above wick of 5 minute entry candle)
Target: (ADR / measured move)
🔍 Post-Trade Analysis
What went right?
Price instantly rejected the level it was at and reached target fairly quickly.
What could have been better?
Could have taken YM for a better setup instead.
Would I take this trade again? Yes. A+ setup but not A+++ due to it not being at a major level like the other indices were.

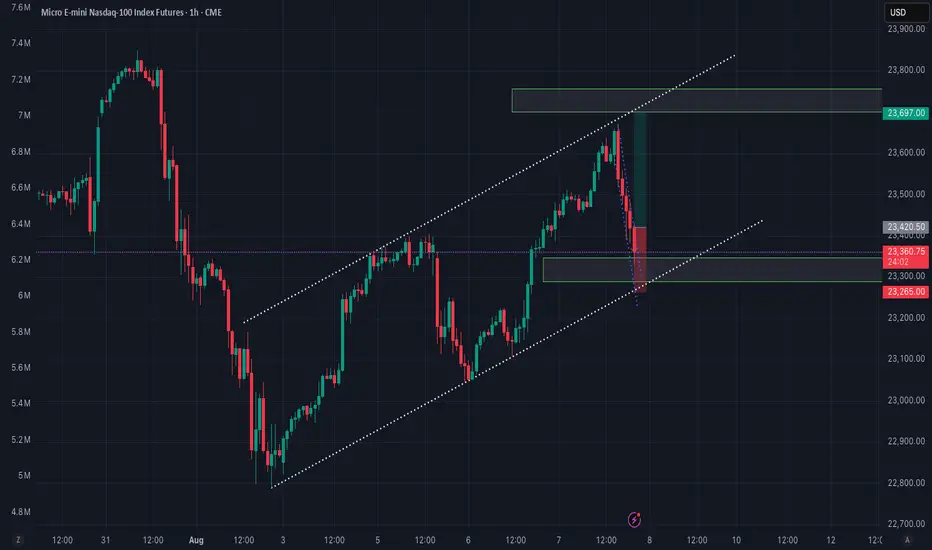
Nasdaq longPossible trade shaping up on the Nasdaq.
1hr trendline a channel with a 50-61.8% fib zone
Previous days profile providing a low volume node as support
5min counter trend failure for possible breakout point. Otherwise, previous lower high or resistance might be worth looking at
NQ Power Range Report with FIB Ext - 8/7/2025 SessionCME_MINI:NQU2025
- PR High: 23481.00
- PR Low: 23384.50
- NZ Spread: 216.25
Key scheduled economic events:
08:30 | Initial Jobless Claims
13:00 | 30-Year Bond Auction
Session Open Stats (As of 12:35 AM 8/7)
- Session Open ATR: 305.25
- Volume: 34K
- Open Int: 285K
- Trend Grade: Long
- From BA ATH: -1.5% (Rounded)
Key Levels (Rounded - Think of these as ranges)
- Long: 23811
- Mid: 22096
- Short: 20383
Keep in mind this is not speculation or a prediction. Only a report of the Power Range with Fib extensions for target hunting. Do your DD! You determine your risk tolerance. You are fully capable of making your own decisions.
BA: Back Adjusted
BuZ/BeZ: Bull Zone / Bear Zone
NZ: Neutral Zone
MNQ SHORT POSITION both setups played out **7:15 AM**
CME_MINI:MNQ1!
one thing to note is I have to be in control with my trigger finger I entered a 2nd position for mnq at the end of the moving into the consolidation lost about 40% of my move ending the day at 300$ after being up 437$
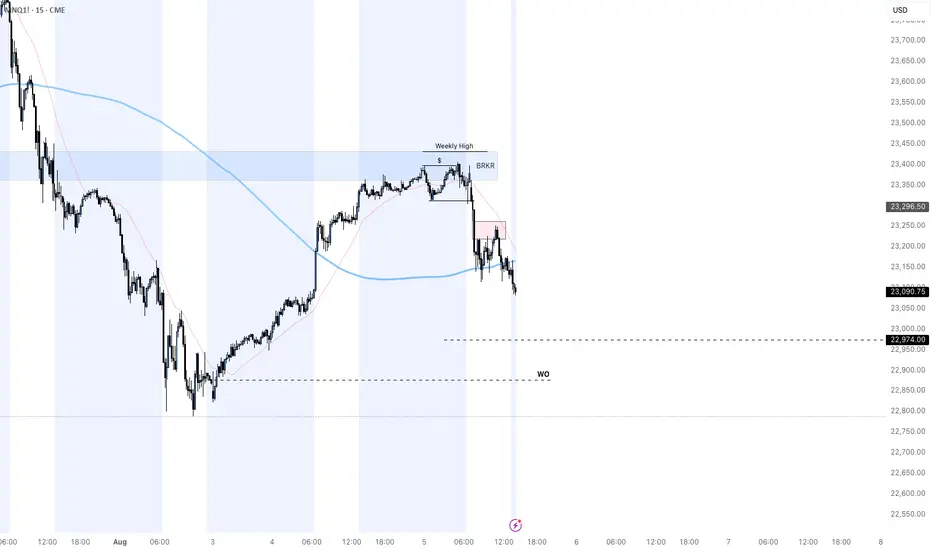
The right time to short nasdaqI shorted when the Nasdaq hit a cluster of prior highs—a well-defined resistance shelf that charts show often attracts heavy supply and stalls rallies, making it a textbook spot where sellers overpower buyers
. Fading the move at that ceiling gives a favorable risk-reward: if price rejects the level, downside potential is wide while upside is capped just beyond the barrier

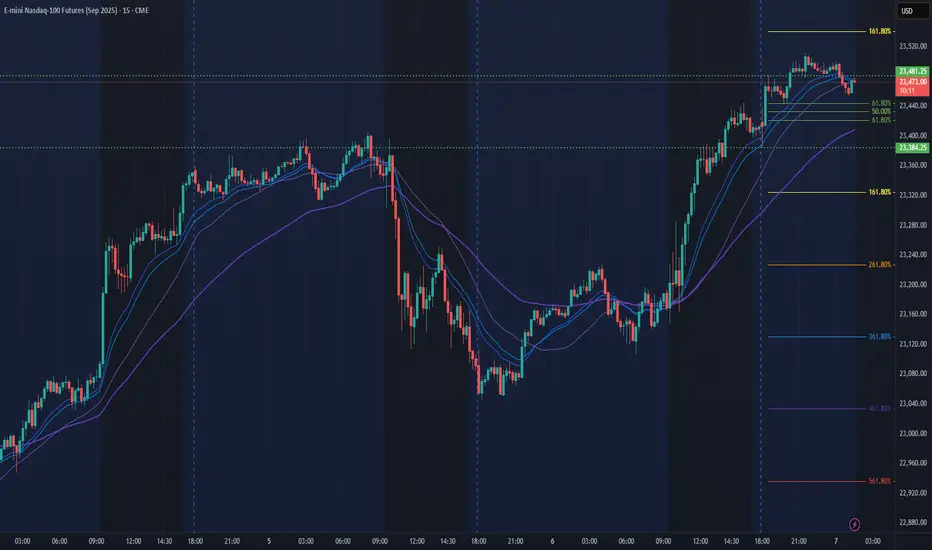
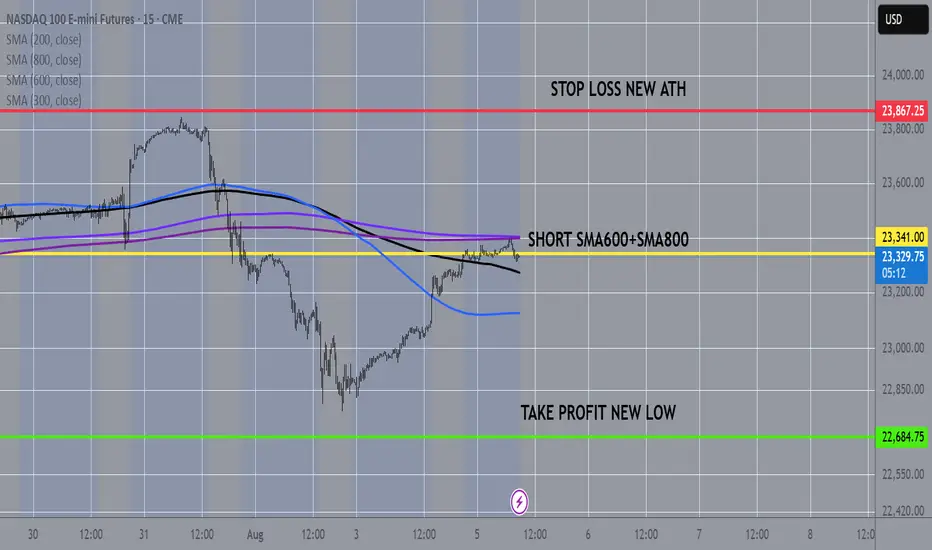
NASDAQ100 15MIN CHART FROM SMAS TO NEW LOWNasdaq100 at 10 and 15min chart touches the sma600 and the sma800 so as in many other cases before, odds are are more that it will fall from here to a new low
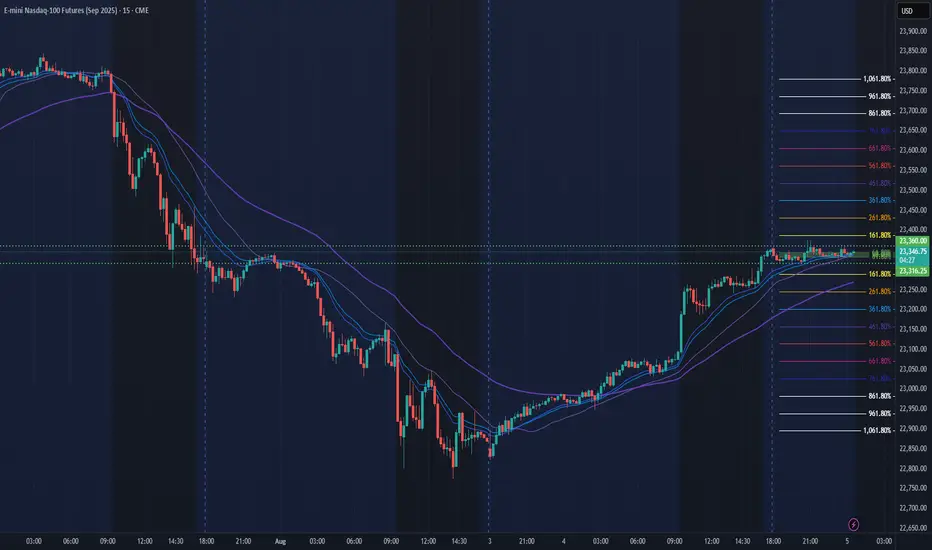
NQ Power Range Report with FIB Ext - 8/5/2025 SessionCME_MINI:NQU2025
- PR High: 23360.00
- PR Low: 23316.25
- NZ Spread: 97.75
Key scheduled economic events:
09:45 | S&P Global Services PMI
10:00 | ISM Non-Manufacturing PMI
- ISM Non-Manufacturing Prices
Session Open Stats (As of 12:35 AM 8/5)
- Session Open ATR: 294.27
- Volume: 23K
- Open Int: 278K
- Trend Grade: Long
- From BA ATH: -2.0% (Rounded)
Key Levels (Rounded - Think of these as ranges)
- Long: 23811
- Mid: 22096
- Short: 20383
Keep in mind this is not speculation or a prediction. Only a report of the Power Range with Fib extensions for target hunting. Do your DD! You determine your risk tolerance. You are fully capable of making your own decisions.
BA: Back Adjusted
BuZ/BeZ: Bull Zone / Bear Zone
NZ: Neutral Zone