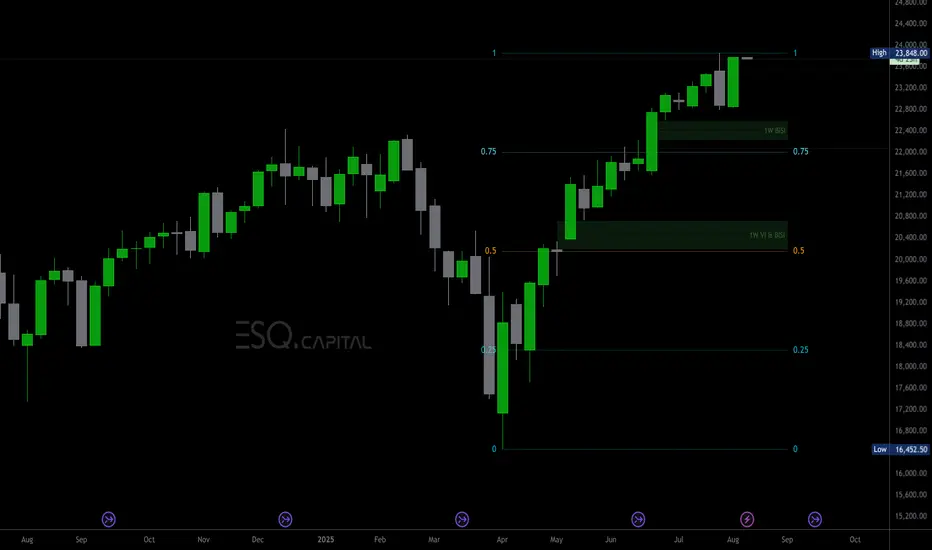
NQ Targets (08-04-25)Many calls did play out last week and looking for some targets to get tested this week. On 7/29 called the Yellow arrow (last week's called range), the white is this week's. NDX has some gaps to retest, YTD chart below and yellow arrows are the targets.
The 30M and 4HR charts are adjusted to matc
Related futures
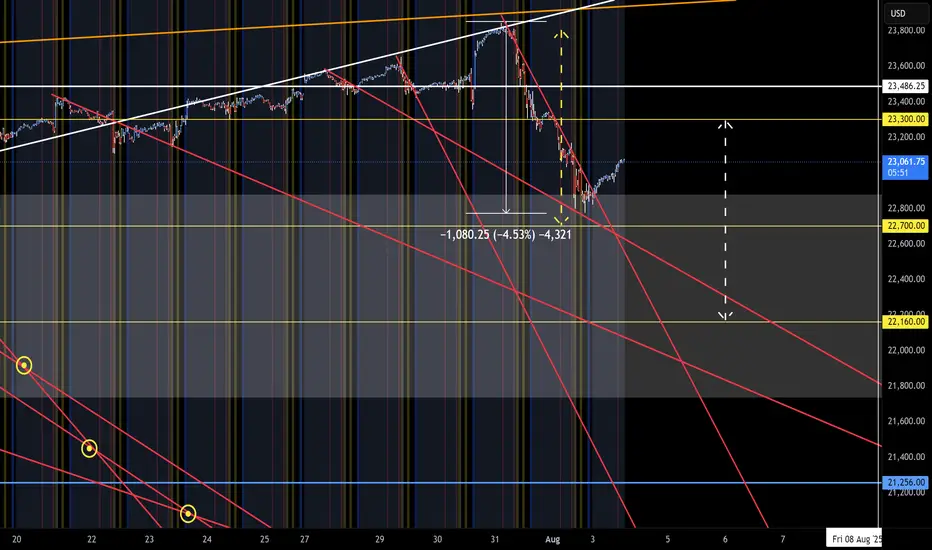
NQ Short (08-11-25)Looking at a Double Top drop at O/N TYD High this week. Red lines are TLX targets lower. Looking for YTD open price level retest to be hit prior to next leg upward. Danger Zone 486 is Long above and Short below for now.

NASDAQ (NQ1!): Bullish! Buy The Pullbacks!Welcome back to the Weekly Forex Forecast for the week of Aug 11 - 15th.
In this video, we will analyze the following FX market:
NASDAQ (NQ1!) NAS100
The NASDAQ is strong and moving higher. No reason to look for sells.
Wall Street advanced on Friday, taking indexes closer to a strong weekly finish

MNQ SET TO MAKE MORE NEW HIGHS, BEWARE OF THE STRONG PULLBACKSWe are very likely to witness CME_MINI:MNQU2025 (and of course NQ) reaching for new highs in the not too distant future.
However it is wise to bare in mind that price having made a high in the previous week of may experience a deep retracement into an area of weekly price inefficiency:
This
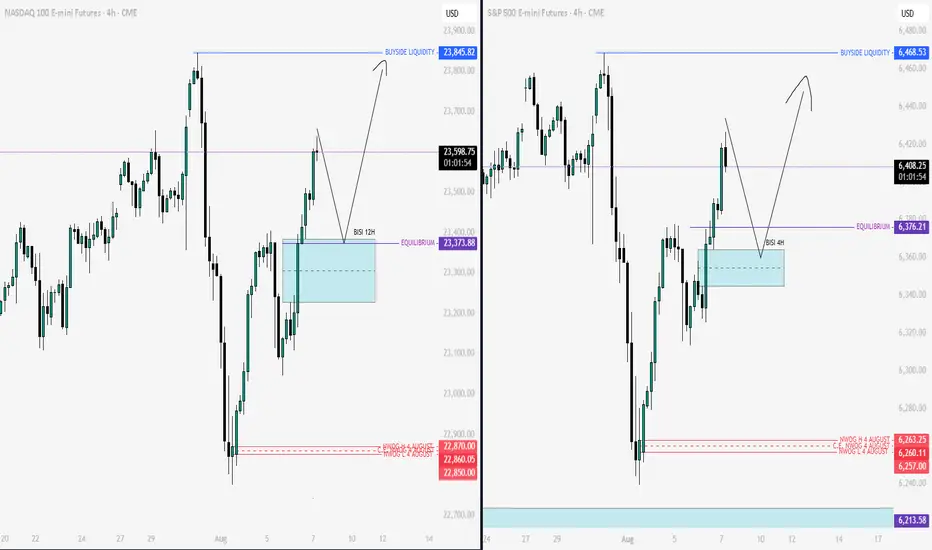
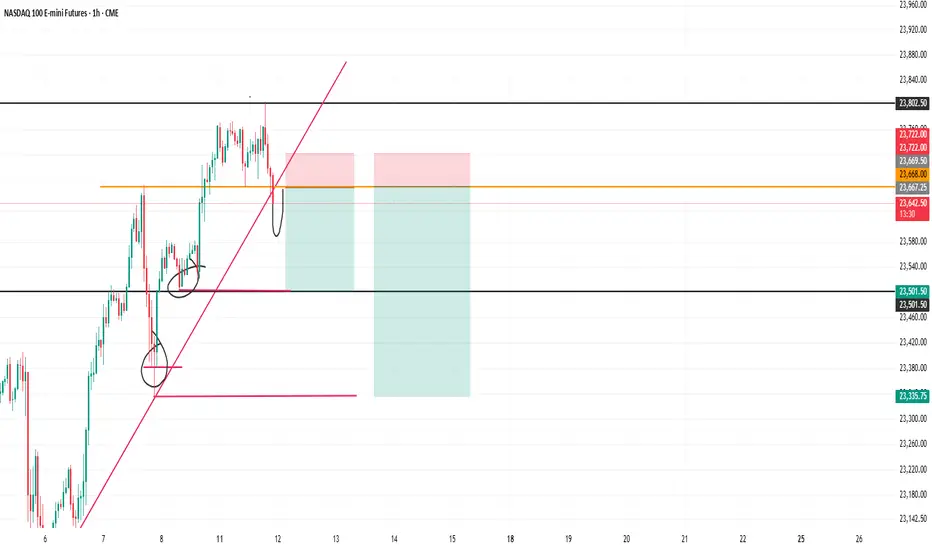
Nq & Es Key Levels & Scenarios 07-08-2025It’s clear that we’re currently operating within a premium zone of the range. The directional bias remains bullish, but I’m anticipating the potential for a short-term short setup around the 09:30 AM New York open, allowing for a retracement before continuation higher.
I will not look for long setup
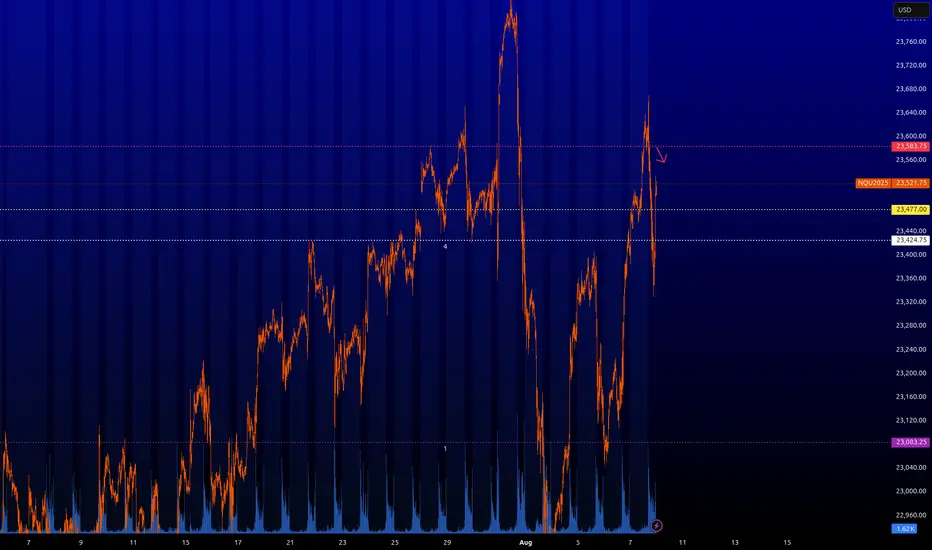
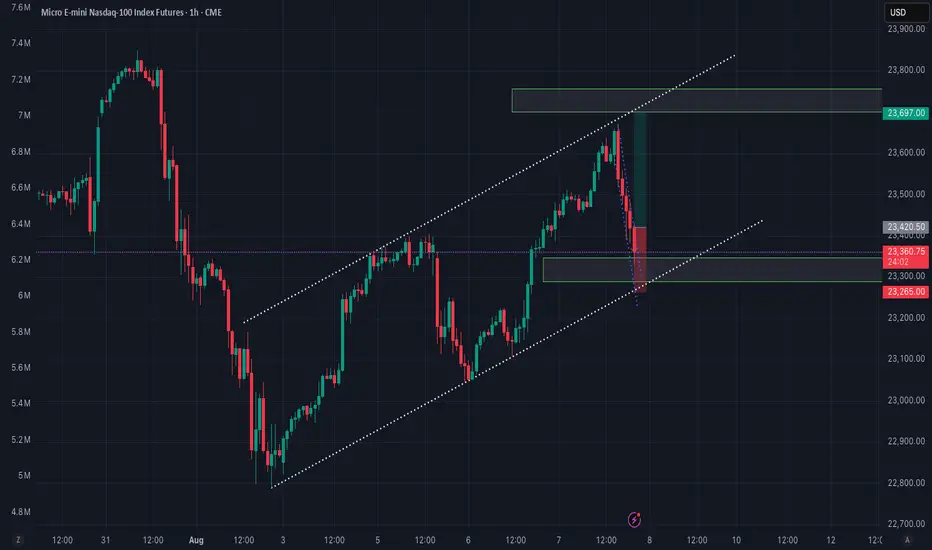
NQ : Short levelThe level has been activated, so you can short it. I have slightly edited it since last time. It is best to scalp or pips it; I cannot promise any significant movement. Be careful when trading on news or at market close/open.
Nasdaq longPossible trade shaping up on the Nasdaq.
1hr trendline a channel with a 50-61.8% fib zone
Previous days profile providing a low volume node as support
5min counter trend failure for possible breakout point. Otherwise, previous lower high or resistance might be worth looking at
Calm Before a StormSince the post-COVID period, we have not seen such a gentle and continuous uptrend. This phenomenon reminds me of the market before the COVID meltdown.
How do I going to interpret this "Gentle & Continuous Uptrend" move?
My answer: Cautiously bullish
Back then, market was cautiously bullish beca

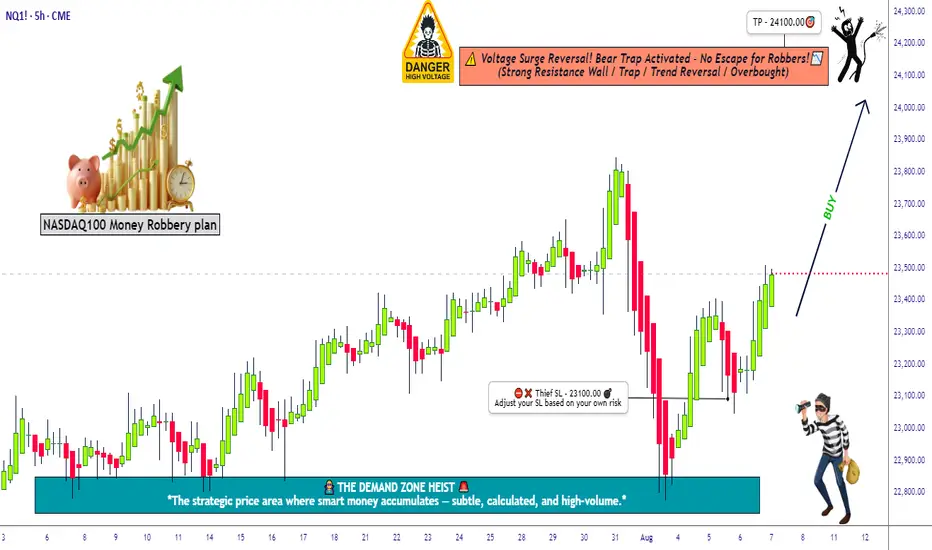
Robbing the Nasdaq Futures | NQ1! Plan with Precise Targets💥🚨NQ1! “E-Mini Nasdaq 100” Heist Alert 🚨💥
🎯Thief Trader Bullish Takeover Plan🕵️♂️📈
🌍 Dear Global Looters & Market Bandits, 💰💸💎
It's time to crack the vaults of the Nasdaq 100 Futures (NQ1!) — Thief-style! No mercy. No fear. Just profits. 🔥
🔓 The digital vault is open — we’re layering multiple lim
NQ Short This is a really really hard decision to make. But it really does look like a short opp in play.
I mean, there is a hard rejection of making higher highs, that only means we are going to correct. Actually if you track back the price, you will see a bearish FVG that is being respected on the daily
See all ideas
Summarizing what the indicators are suggesting.
Neutral
SellBuy
Strong sellStrong buy
Strong sellSellNeutralBuyStrong buy
Neutral
SellBuy
Strong sellStrong buy
Strong sellSellNeutralBuyStrong buy
Neutral
SellBuy
Strong sellStrong buy
Strong sellSellNeutralBuyStrong buy
A representation of what an asset is worth today and what the market thinks it will be worth in the future.
Frequently Asked Questions
The current price of Micro E-mini Nasdaq-100 Index Futures (Jun 2026) is 24,649.50 USD — it has fallen −0.31% in the past 24 hours. Watch Micro E-mini Nasdaq-100 Index Futures (Jun 2026) price in more detail on the chart.
Track more important stats on the Micro E-mini Nasdaq-100 Index Futures (Jun 2026) chart.
The nearest expiration date for Micro E-mini Nasdaq-100 Index Futures (Jun 2026) is Jun 18, 2026.
Traders prefer to sell futures contracts when they've already made money on the investment, but still have plenty of time left before the expiration date. Thus, many consider it a good option to sell Micro E-mini Nasdaq-100 Index Futures (Jun 2026) before Jun 18, 2026.
Open interest is the number of contracts held by traders in active positions — they're not closed or expired. For Micro E-mini Nasdaq-100 Index Futures (Jun 2026) this number is 16.00. You can use it to track a prevailing market trend and adjust your own strategy: declining open interest for Micro E-mini Nasdaq-100 Index Futures (Jun 2026) shows that traders are closing their positions, which means a weakening trend.
Buying or selling futures contracts depends on many factors: season, underlying commodity, your own trading strategy. So mostly it's up to you, but if you look for some certain calculations to take into account, you can study technical analysis for Micro E-mini Nasdaq-100 Index Futures (Jun 2026). Today its technical rating is strong buy, but remember that market conditions change all the time, so it's always crucial to do your own research. See more of Micro E-mini Nasdaq-100 Index Futures (Jun 2026) technicals for a more comprehensive analysis.