NQ Short (05-19-25)Same plan as prior Post, Short. The play is that the NAZ will try some FA's below (Shaded Zones) and then U Turn up during some late low volume Holiday session and attempt ATH retest. No U Turn, next SZ lower. Long above KL 365 and Short below. Price Action is all about Tricks, Tweets, Games and any low volume session opportunity (long side now). Still want to retest the 15m 2,000 point blast zone.
NQU2023 trade ideas

Reversal Fakeout to Grab liquidity NQ1In this bullish continuation setup, big players (institutional traders, hedge funds, and market makers) are actively maneuvering around key levels. After price bounces from the Order Block area, these entities aim to manipulate liquidity by triggering stop-loss placements before continuing the trend.
How They Operate:
Stop-Hunting: Institutions know where retail traders place stops—often below key support or VWAP. They drive price lower to collect liquidity before pushing the market higher.
Fakeout Moves: A sudden dip below VWAP or the Order Block might shake out weak hands before price aggressively resumes the bullish trend.
Accumulation Before Expansion: Large players accumulate positions inside the Order Block area while creating an illusion of bearish pressure, trapping shorts before the next push up.
Trade Psychology & Execution:
Spot the Trap: If price dips unexpectedly, assess volume spikes—if liquidity is being swept without follow-through downside movement, it’s likely a stop-hunt.
Hold Strong Levels: A bullish continuation may unfold after liquidity is collected, as institutions reclaim price above VWAP, fueling the next leg higher.
Strategic Stop Placement: Avoid placing stops too close to obvious levels—consider wider stops below strong liquidity zones to survive manipulation tactics.
The key takeaway? Smart money plays around liquidity zones, forcing weak hands out before driving price in the intended direction. Stay patient, analyze the setup, and position wisely to ride the bullish wave after the institutions have had their turn.
Follow @GoldenZoneFX For more content and valuable insights.

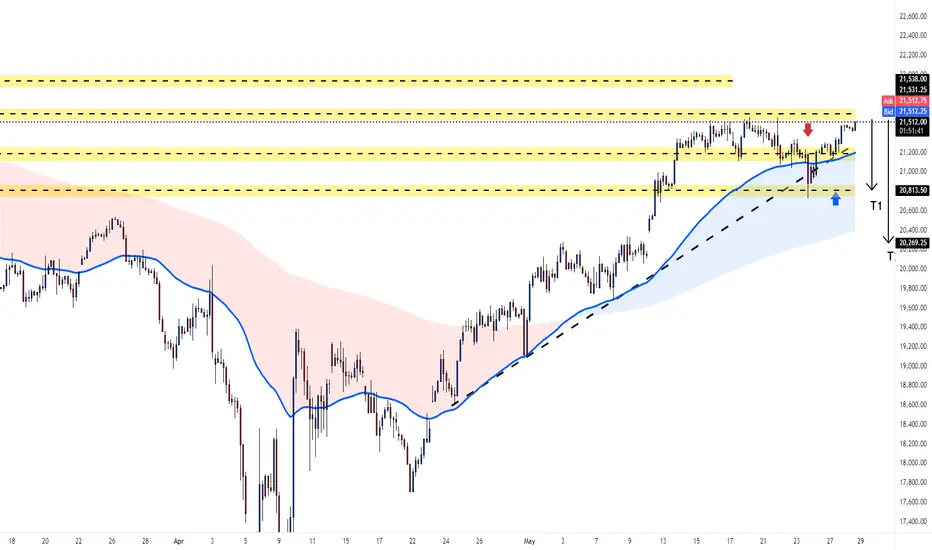
This is a 4-hour chart of the NASDAQ 100 index (NQ1!). Analysis:
Trend and Support: The chart shows an ascending trendline (black dashed line) acting as support, with the price recently bouncing off it around the 20,260 level. This suggests the uptrend remains intact for now.
Price Action: The price has pulled back from a high near 21,500 ish and is currently consolidating around 21,000. The recent bounce off the trendline indicates potential buying interest at lower levels.
Key Levels:
Resistance Zone: The yellow shaded area between 21,200 and 21,550 is a resistance zone where the price previously struggled.
Support Zone: The area around 20,800–20,900 (another yellow shaded area) may act as immediate support if the price dips again.
Targets: T1 (20,813.50) and T2 (20,626.25) are marked as potential downside targets if the price breaks below the trendline. On the upside, breaking above 21,550 could target 21,800 (top of the resistance zone).
Market Sentiment: The order book on the right shows the current ask at 21,531.25 and bid at 21,506.25, with a tight spread indicating decent liquidity. The price is slightly below the ask, suggesting some selling pressure or hesitation to break higher immediately.
Potential Scenarios:
Bullish: If the price holds above the trendline and breaks 21,400, it could rally toward 21,800 or higher.
Bearish: A break below the trendline and 20,800 support could lead to a deeper pullback toward T1 (20,813.50) or T2 (20,626.25).
Insight: The NASDAQ 100 is in an uptrend but facing resistance near 21,400. Watch for a breakout above this level for bullish confirmation or a break below the trendline for a bearish move. The 20,800–20,900 zone is a key support to monitor.
MNQ Long15min - awareness of lower POI
liquidity, manipulation, sweep, imbalance and mitigation around the 78.6

#NQ1! "E-Mini Nasdaq 100" Index Market Bullish Robbery Plan 🌟Hi! Hola! Ola! Bonjour! Hallo! Marhaba!🌟
Dear Money Makers & Robbers, 🤑 💰💸✈️
Based on 🔥Thief Trading style technical and fundamental analysis🔥, here is our master plan to heist the NQ1! "E-Mini Nasdaq 100" Index Market Heist. Please adhere to the strategy I've outlined in the chart, which emphasizes long entry. Our aim is to escape near the high-risk YELLOW MA Zone. It's a Risky level, overbought market, consolidation, trend reversal, trap at the level where traders and bearish robbers are stronger. 🏆💸"Take profit and treat yourself, traders. You deserve it!💪🏆🎉
Entry 📈 : "The heist is on! Wait for the Crossing previous high (19800) then make your move - Bullish profits await!"
however I advise to Place Buy stop orders above the Moving average (or) Place buy limit orders within a 15 or 30 minute timeframe most recent or swing, low or high level for Pullback entries.
📌I strongly advise you to set an "alert (Alarm)" on your chart so you can see when the breakout entry occurs.
Stop Loss 🛑: "🔊 Yo, listen up! 🗣️ If you're lookin' to get in on a buy stop order, don't even think about settin' that stop loss till after the breakout 🚀. You feel me? Now, if you're smart, you'll place that stop loss where I told you to 📍, but if you're a rebel, you can put it wherever you like 🤪 - just don't say I didn't warn you ⚠️. You're playin' with fire 🔥, and it's your risk, not mine 👊."
📍 Thief SL placed at the nearest/swing low level Using the 2H timeframe (19200) Day trade basis.
📍 SL is based on your risk of the trade, lot size and how many multiple orders you have to take.
🏴☠️Target 🎯: 20500
🧲Scalpers, take note 👀 : only scalp on the Long side. If you have a lot of money, you can go straight away; if not, you can join swing traders and carry out the robbery plan. Use trailing SL to safeguard your money 💰.
💰💵💸NQ1! "E-Mini Nasdaq 100" Index Money Heist Plan is currently experiencing a bullishness,., driven by several key factors. .☝☝☝
📰🗞️Get & Read the Fundamental, Macro Economics, COT Report, Geopolitical and News Analysis, Sentimental Outlook, Intermarket Analysis, Index-Specific Analysis, Future trend targets with Overall outlook score... go ahead to check 👉👉👉🔗🔗🌎🌏🗺
⚠️Trading Alert : News Releases and Position Management 📰🗞️🚫🚏
As a reminder, news releases can have a significant impact on market prices and volatility. To minimize potential losses and protect your running positions,
we recommend the following:
Avoid taking new trades during news releases
Use trailing stop-loss orders to protect your running positions and lock in profits
💖Supporting our robbery plan 💥Hit the Boost Button💥 will enable us to effortlessly make and steal money 💰💵. Boost the strength of our robbery team. Every day in this market make money with ease by using the Thief Trading Style.🏆💪🤝❤️🎉🚀
I'll see you soon with another heist plan, so stay tuned 🤑🐱👤🤗🤩

MNQ Buy Idea 5.29.25 (Part 2)Continuation of the first video entry of this trade.
We were aiming for $200 in profits today but failed to get that, ending with $61 in profits. I don't think we will be entering another trade due to the time and also that I want to focus on reading my book "The Trading Game" by Ryan Jones.
If you guys found this insightful give it a 🚀, it helps me see that you guys learned something from watching this and motivates me to post more.
Drop your comments down below, do you think MNQ is bullish or bearish? What prices do you see MNQ reaching?

NASDAQ Meltdown Incoming? The Calm Before the Crash…🚨 Get ready! The NASDAQ is about to take us on a wild plunge straight to the depths of market hell... 💥🔥
Yes, yes, I know—they’ll say it’s all "because of this" or "due to that," the usual play-acting we’ve seen a hundred times before. Just another scene in the never-ending economic theater. 🎭
But here’s the forecast for tomorrow’s news:
📉 United States Initial Jobless Claims – possibly lower than expected?
📈 United States GDP Growth Rate QoQ – higher than expected?
And then... yada yada yada. You know the rest.
What does that mean? A chain reaction in risk-on assets — stocks, indexes, crypto — all heading for a steep drop. 💣📉
If you’re still a believer, here’s your solid proof — laid out 24 hours before it happens. Don’t say we didn’t warn you.
The choice is yours:
💊 Red pill or blue pill?

long nasdaqheres 2 very basic examples of what i think could play out on the nasdaq... personally i think were overbought and need a pullback.. not looking to short this market tho, am watching for a momentous push threw the highs. or to get long on a pullback
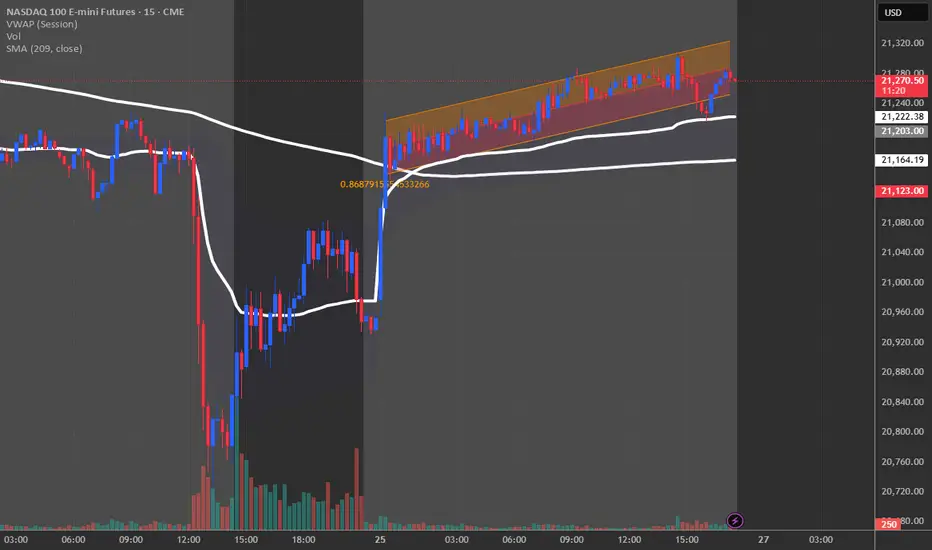
Aggressive Moves Around VWAP: The CatalystWhen NQ1 exhibits an aggressive move relative to the VWAP, it typically indicates that large players—such as institutionals and hedge funds—are taking notice. An aggressive break above the VWAP can signal strong bullish momentum, while an aggressive breakdown below it suggests equally forceful bearish pressure. In both instances, the intensity of the move often precedes a significant directional commitment from the market.
The Critical Role of Pullback Confirmation
However, the initial surge or drop isn’t enough on its own for a reliable signal. The true confirmation comes when the price pulls back to the VWAP. For instance:
Bullish Scenario: After an aggressive upward breakout, if the price retests the VWAP and forms a solid bullish (green) candle, this pullback confirmation reinforces that the move is supported by institutional buying. It reassures traders that the upward momentum isn’t a false breakout, giving greater confidence in a long position.
Bearish Scenario: Conversely, if the price aggressively falls below the VWAP and then pulls back to retest it—this time showing a strong bearish (red) candle—it signals that the downtrend is supported and genuine. The pullback confirmation filters out noise and helps avoid premature exits or entries.
This "Break + Confirmation" setup is key to distinguishing between fleeting price fluctuations and sustainable trends in NQ1.
What This Reaction Tells Us
The way NQ1 reacts when nearing the VWAP is essential in shaping trade decisions:
An aggressive move signals a readiness of the market to commit in one direction.
A subsequent pullback and confirmation via a decisive candlestick pattern validates that initial move.
This dual-phase validation offers a high-probability scenario because it not only captures the momentum but also ensures that the price level around the VWAP holds up as a pivot point.
This approach helps to avoid false breakouts, ensuring that a directional bias—either long or short—is only taken once the market has clearly reasserted its intent through a retest phase.
In Summary
Observing how NQ1 reacts around the VWAP provides powerful clues about market sentiment:
Breakout or Breakdown: Aggressive moves away from the VWAP indicate that market forces are strong.
Retest Confirmation: A pullback to the VWAP with a confirming candle (green for bullish, red for bearish) is the reliable trigger for high-probability trading entries.
Institutional Insight: These moves often mirror the actions of larger market players who are shaping the next leg of the trend.
Ultimately, the strategy revolves around patiently waiting for both the aggressive move and the subsequent confirmation to align, thereby filtering out noise and solidifying a clear trade bias.
NQ Power Range Report with FIB Ext - 5/30/2025 SessionCME_MINI:NQM2025
- PR High: 21395.25
- PR Low: 21335.25
- NZ Spread: 134.0
Key scheduled economic events:
08:30 | Core PCE Price Index (YoY|MoM)
09:45 | Chicago PMI
Rotation off 21850
- Previous session print advertising decline back to week low
Session Open Stats (As of 1:25 AM 5/30)
- Session Open ATR: 446.48
- Volume: 33K
- Open Int: 267K
- Trend Grade: Neutral
- From BA ATH: -5.6% (Rounded)
Key Levels (Rounded - Think of these as ranges)
- Long: 22096
- Mid: 20383
- Short: 19246
Keep in mind this is not speculation or a prediction. Only a report of the Power Range with Fib extensions for target hunting. Do your DD! You determine your risk tolerance. You are fully capable of making your own decisions.
BA: Back Adjusted
BuZ/BeZ: Bull Zone / Bear Zone
NZ: Neutral Zone

Poor executions on MNQ A little post for transparency, down -$225 for the day. Made some error trading mistakes. I should've just closed the charts and been content with my $60 profit. But I still learned a lot through staying on the charts and watching price.
10am candle not breaching its highs and failing to take it was a great indication that the candle wanted to target sell-side -- let my feelings get me a little excited today and that ended up resulting in losses. I will take the losses for today and check back in around 2pm and if not later today at 2pm, I'll be trading tomorrow morning NY session.
Talk to you guys soon! Give a 🚀 if you found this insightful.

MNQ Buy Idea 5.29.25 (Part 1)Targeting buy-side with this 10AM candle.
Wanted price to take the highs of the 10am open, but we seemed to have failed to as of 11am, SL was hit unfortunately for a final profit of $61 for today.
This will be all for me as I am taking it easy and not pushing/forcing any trades. I will be uploading part 2 to this video once this one is rendered for those interested.

Nvidia Earnings Boost, Trade Tariffs Legitimacy, NQ trade ideaCME_MINI:NQ1!
Big Picture Context: .
NQ futures rallied after NVIDIA posted an earnings beat and after the Manhattan-based Court of International Trade blocked President Trump's Liberation Day tariffs.
Goldman Sachs noted that the ruling on Liberation Day tariffs gives the administration 10 days to halt tariff collection, but does not affect sectoral tariffs. The administration can still impose across-the-board and country-specific tariffs under other legal authorities.
Jobless claims and continuing claims have come in higher.
What has the market done?
The rally faded in the overnight session. However, the catalysts provided energy for prices to move higher. Currently, price is trading above the prior week’s high, yesterday’s high, and it is also trading above the yearly open, and 2025 VPOC and mcVPOC for the last 3 weeks.
What is it trying to do?
The market is negating the recent bear market territory sell-off and negating a bear market rally. It is propelling higher.
How good of a job is it doing?
The market has created good structure and micro composites, despite some gaps left open, and it has created higher lows since last Friday.
What is more likely to happen from here?
Scenario 1: Long Continuation
In this scenario, we are looking for NQ to turn at the immediate 2025 LVN support area. If it edges higher, we will be looking for potential long opportunities above the 21710–21720 area, targeting overnight highs and potentially the next HVN.
Scenario 2: Gap Close and Reversal
In this scenario, we are looking for a pullback, testing pHi and pWk-Hi. We will look for a rounded base that consolidates here on a lower timeframe, such as the 5-minute timeframe, and look for a reversal back towards the 21710–21720 level.
pWk-Hi: prior Week's High
pHi: prior Day's High
HVN: High Volume Node
LNV: Low Volume Node
VPOC: Volume Point of Control
C: Composite (prefix before VAL, VAH, VPOC, VP, AVP)
mC: micro-Composite (prefix before VAL, VAH, VPOC, VP, AVP)

Nasdaq - 1 - 2 Months wavesAS outlined in the graph. Based on the current fib level it doesn't seem like a good enough correction, so I am assuming it could be an extensive correction wave. Great short zone at this moment.

How To Read Trading ChartsIn this video, I discuss how to read and interpret the bars/candles on a chart so you can begin to learn price action.


Sell then Buy NQSelling from market vol movement. Buy for sustained trend similar to Gold. Slipping for too many reasons

Nasdaq 100 3 Bar Trendline now Intact!Hey traders so as you can see you don't need indicators just a simple drawing of a straightline to try to get on the right side of the market. Does it always work NO but most of the time it does. So now we need to wait for the pullback before considering to enter from the long side. Have your order ready and always use risk management.
Don't chase the market let it come to you!
Enjoy,
Clifford

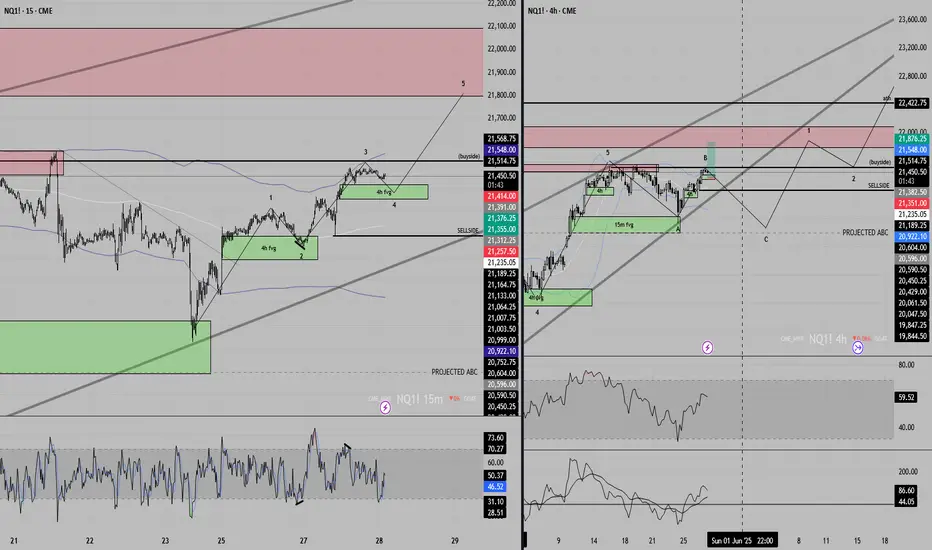
NQ Futures – Smart Money Concepts (15m)📅 May 22, 2025 | Analysis by Wavervanir International LLC
We're tracking a clear distribution structure on the 15-minute NQ chart. Here's a breakdown of our thesis:
🔍 Market Structure:
Multiple CHoCHs followed by a confirmed Break of Structure (BOS) at ~21,100
Rejection from Premium Zone near 21,475–21,550
Current price is reacting around Equilibrium (0.5 FIB) at ~21,234
🧠 Smart Money Outlook:
Order blocks are aligning with a potential bearish continuation
Expecting a move towards the Discount Zone between 21,040–21,000
Below that, confluence builds near the 1.272–1.414 FIB extension, targeting 20,845.75
📉 Projection:
We're looking for a liquidity sweep below the weak low (~21,040), followed by a potential reaction at 20,845.75. Volume is spiking near bearish zones—suggesting institutional unloading.
🔻 Probability favors downside continuation toward the blue liquidity pool.
📍 Short Bias remains valid unless invalidated above 21,350.
#NQ #NASDAQ100 #SmartMoney #S&P500 #VolumeProfile #Fibonacci #Liquidity #TradingView #WavervanirAnalysis #FuturesTrading #PriceAction #RiskManagement

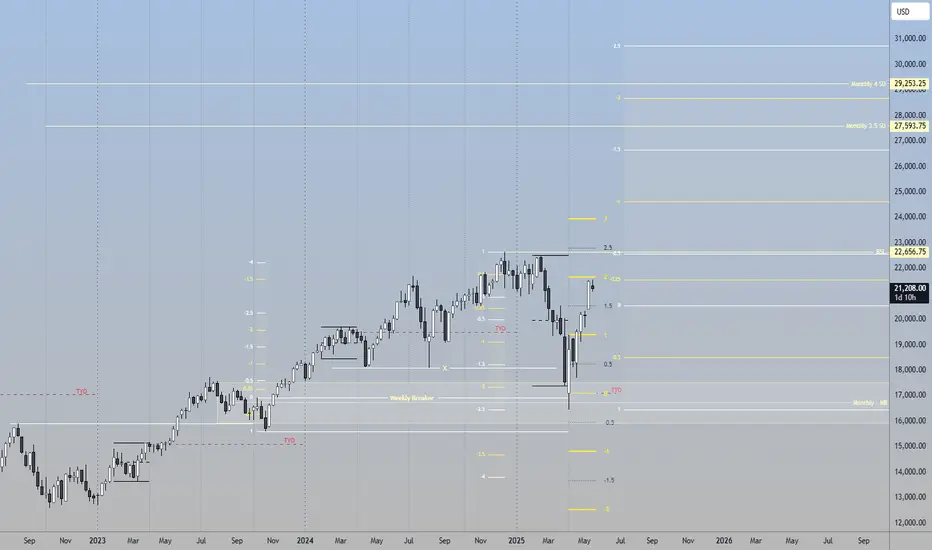
NASDAQ LONG TERM VIEWWeekly time frame, After faking everyone out with 'recession' and trade wars. Equities have made a strong recovery almost recovering all the losses from the start of the year. There may be a small retracement back to $20,500 level where i will accumulate longs before the massive expansion. Strap in!
2025.05.22 nasdaq analysis🔸 Daily Chart Perspective
On the daily timeframe, we can see that the recent low was made within the demand zone, but the market began to fall just before the U.S. session closed. The Asian session appears to be in wait-and-see mode for now.
If the trend continues downward, the red box to the left suggests the possibility of a one-way bearish move. In such a case, a drop toward the 20583 area is open.
The daily 20EMA is also near that zone, and since a one-way drop occurred in the red box area before, the possibility is quite realistic.
🔸 1-Hour Chart View
On the 1H chart, the Nasdaq seems to be forming an expanding wedge.
It's hard to say that a trend reversal to the downside is confirmed yet, because price is still inside the expanding pattern.
However, since the market seems to have formed a short-term top, it gives us a sense of direction for short-term trading.
If the price enters the black box area to the left, that could be seen as a complete trend reversal.
🔸 Today’s Trading Plan
At this point, due to yesterday's sharp drop, there’s no clear buy zone visible.
Only short positions are planned for today.
Short Setup #1
Entry: On break below 21112
TP 1: 21075
Short Setup #2
Entry: On break below 21070
TP 1: 20996
Short Setup #3
Entry: On break below 20970 + trendline break
TP Max: 20830 ~ 20770
🔹 Conclusion
It looks like the trend is leaning toward the downside, but it's best to enter positions only after price breaks out of key support zones.

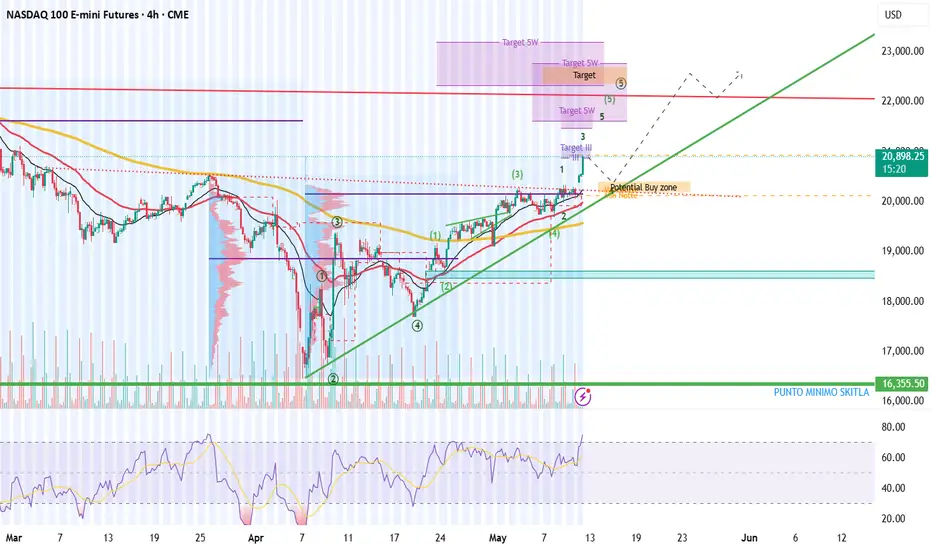
NASDAQ - Long strategyNASDAQ - Long strategy
After this big impulse is expected a retracement of price.
In this moment there isn't any certains .. we are a boat in Trump sea ..
From technical point of view we can approuch divided entry trade..
By anailys we can have a retracement for wave 4 and after a new long until end of 5 Wave .. ofter this last wave we can have a deep new short wave.
Final targer should be 22500
22/5/25 NQ INTRADAY PLANWould be nice to see another day where AM session boosts up and them PM session completely reverses. Looking at OTE of the range paired with M15 Breaker and SD levels.
