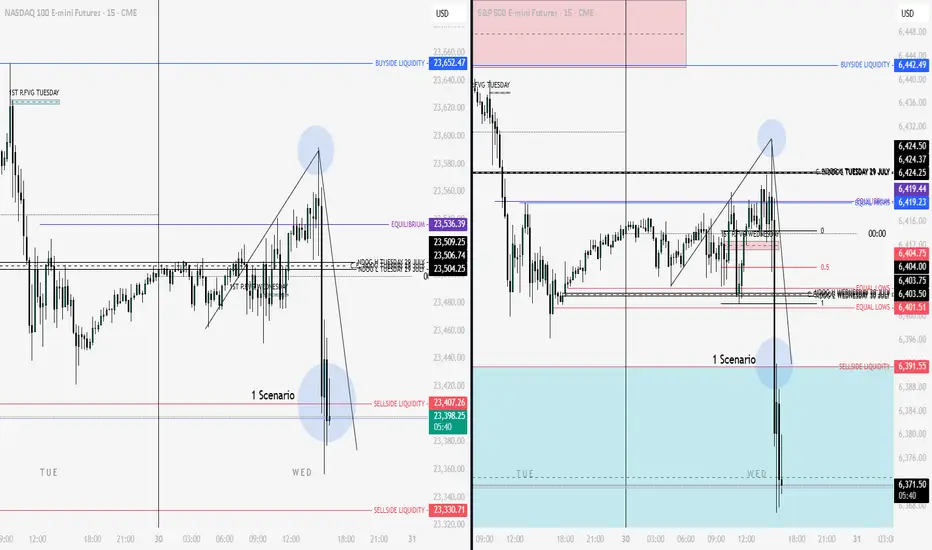
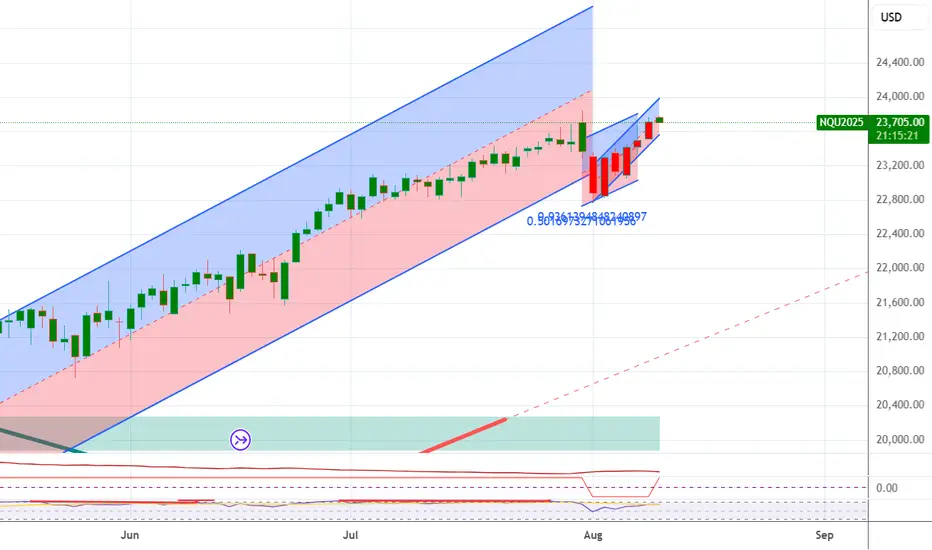
MNQ INTRADAY - COULD WE SEE PRICE AT 23,450 AGAINAt the time of this Idea - Before the Opening Bell on Monday 11th August 2025, CME_MINI:MNQU2025 appears to be respecting the Premium-High it finds itself in.
This could mean that price may MOVE OUT of a buyside-program where higher highs are achieved, as buyside liquidity is sought, and into a sell-side program where discount areas of interest are engaged and a descent in price occurs.
Could we see CME_MINI:MNQU2025 reach down towards 23,450 during this trading session, or will tomorrow's pending core inflation figures cause today's price action to stall in anticipation of the release of the reports?
Also look out for U.S. trade tariff related developments that may pull up any surprises.
Profitable trading guys!
NQ1! trade ideas
No Daily Bias This Week - Back Monday 09:00 NY TimeHeads-up traders! 🚨
This week I’ll be taking a step back — no daily bias, no key levels, no price forecasts.
It’s a sacred week for me, as we celebrate the great Feast of our Holy Mother 🙏, and I’ve decided to use this time to rest and recharge.
Wishing you all an amazing week, whatever you’re up to.
For those watching the charts — stay sharp and manage your risk.
📅 Back on: Monday @ 09:00 AM NY Time — I’ll be here with the daily breakdown, sharing my key levels and possible scenarios for what price might do, and how we can position ourselves to take advantage of it.
Until then — trade safe & see you soon! 🔥
NQ: 231st trading session - recapIgnore this, way too late posting this.
Idk why I keep forgetting man, from this point on I will post it after every session.

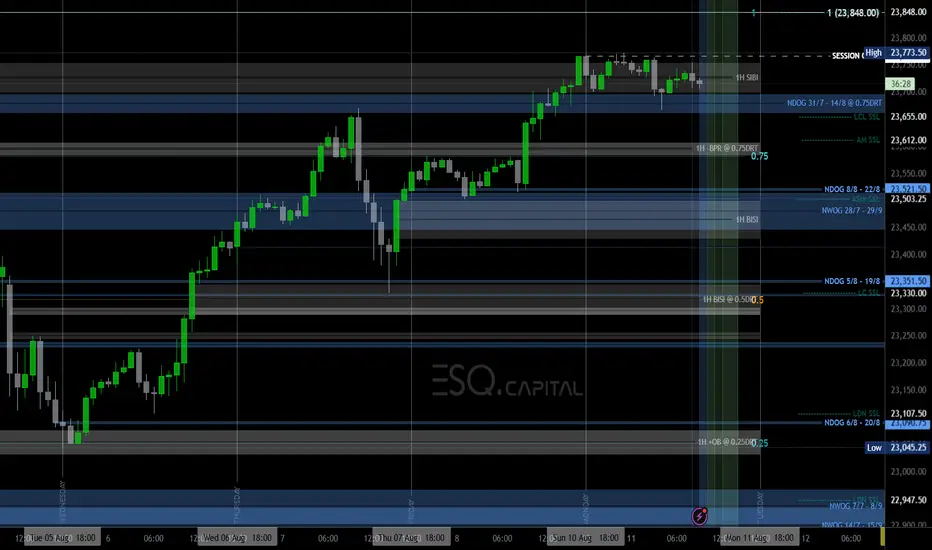
NQ Power Range Report with FIB Ext - 8/11/2025 SessionCME_MINI:NQU2025
- PR High: 23770.75
- PR Low: 23725.00
- NZ Spread: 102.25
No key scheduled economic events
Session Open Stats (As of 12:35 AM 8/11)
- Session Open ATR: 299.17
- Volume: 27K
- Open Int: 291K
- Trend Grade: Long
- From BA ATH: -0.3% (Rounded)
Key Levels (Rounded - Think of these as ranges)
- Long: 23811
- Mid: 22096
- Short: 20383
Keep in mind this is not speculation or a prediction. Only a report of the Power Range with Fib extensions for target hunting. Do your DD! You determine your risk tolerance. You are fully capable of making your own decisions.
BA: Back Adjusted
BuZ/BeZ: Bull Zone / Bear Zone
NZ: Neutral Zone
NAS100 LongNAS100 is now net long on the regression break.
I am considering my options and EA on this pair and others within the index.
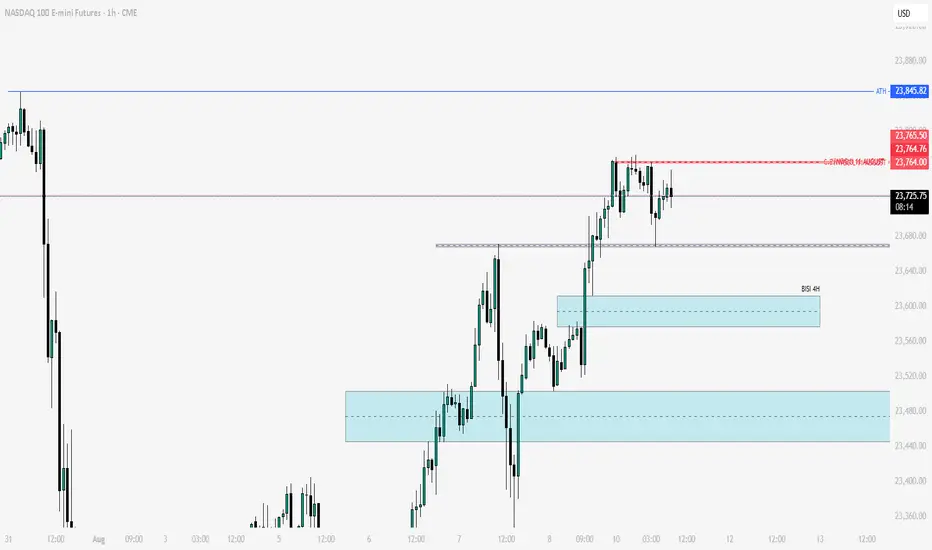
Bullish consolidation for the week ahead ATH incoming📊 Market Structure
Relentless rally from June lows now pressing the All-Time High (23,846.25).
Structure remains bullish on higher timeframes — no major break in market structure.
Current advance is the third leg in the July–August push:
Leg 1: Weekly VAL → VAH rotation.
Leg 2: Pullback into FVG, breakout continuation.
Leg 3: Drive into ATH and projected reversal/consolidation zone.
🔍 Volume Profile Context
Weekly VAH: 23,564.50 — first key support on any pullback.
Weekly POC: 23,261.75 — deeper rotation target if VAH fails.
Weekly VAL: 23,113.00 — trend invalidation level.
Implication:
Acceptance above ATH = new value being built higher.
Failure at ATH + daily close below VAH = rotation back to POC.
🎯 Target Zones
Upside:
23,950–24,000 → thin volume pocket + psychological magnet.
24,250–24,300 → projected consolidation range top.
Downside:
23,564.50 (VAH) → breakout retest.
23,261.75 (POC) → main rotation target on failed breakout.
⚠️ Invalidation Triggers
Aggressive rejection from ATH with strong sell volume → short-term bear rotation.
Sustained acceptance above ATH → squeeze into 24,300 likely.
📰 Macro Catalysts This Week
Wed 8:30 AM EST — CPI: Main driver for breakout or reversal.
Thu 8:30 AM EST — Jobless Claims: Weak print = more cut bets, bullish for NQ.
All Week: China stimulus chatter & oil above $90 remain sentiment drivers.
🛠 Bias for the Week
Bullish above ATH, cautious in reversal zone.
Expect some consolidation above 23,846 before any expansion. CPI is the key trigger for direction — dovish print could send us straight into 24,300, hot print risks full rotation back to VAH.
💡 Plan:
Above ATH with acceptance = long bias into 23,950–24,300.
Failure at ATH with breakdown below VAH = short bias into POC.

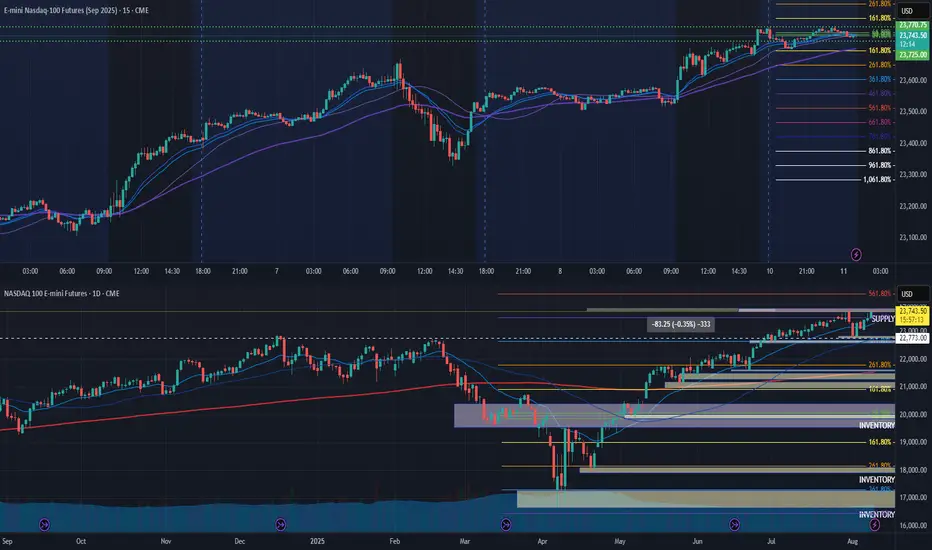
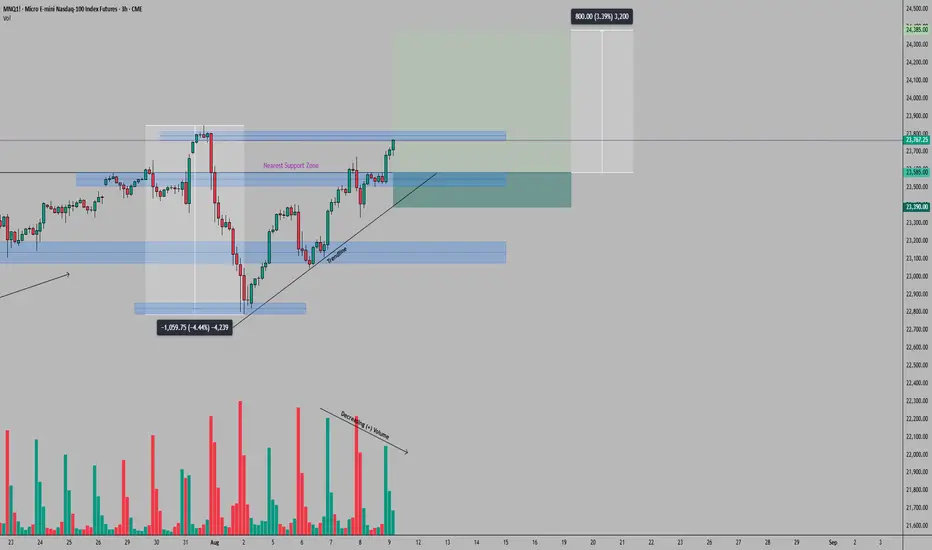
MNQ (Micro Nasdaq 100 Futures) Trade Setup – 3H TimeframeOn the 3-hour timeframe, MNQ has reached a critical juncture after establishing a new all-time high above the 23,800 mark on July 31, 2025. The subsequent sharp correction to the 22,800 zone and equally sharp V-shape recovery demonstrates strong underlying market dynamics. However, the declining positive volume during the recent upward movement suggests waning bullish momentum, even as price approaches the previous highs.
The market structure remains constructively bullish with higher lows and higher highs, but the volume pattern raises concerns about sustainability at these levels. The confluence of the previous all-time high area and declining volume creates conditions favorable for a tactical pullback to nearby support before any sustained breakout attempt.
Illustrative Setup: A Buy Limit order at 23,585 aligns with the upper boundary of the nearest support zone. The Stop Loss placement at 23,390 sits below both the support zone and the recent trendline, providing clear invalidation if breached. The Take Profit target at 24,385 represents a 76% recovery level from the recent 4.44% decline, offering an attractive risk-reward ratio of 4.1:1.
Key caution: While a break above 23,800 remains possible, the declining volume suggests potential for a bull trap. Traders should resist FOMO-driven entries above resistance and instead maintain discipline in waiting for a pullback to materialize a low-risk, high-probability setup.
This analysis is provided solely for educational and entertainment purposes and does not constitute any form of financial or investment advice. Always manage your risk and trade responsibly.
NQ. Market Efficiency Paradigm. Weekly Outlook 10.08.2025, CME_MINI:NQ1!
Covered the daily and hourly order flow.

Let's make this journey fun. Lets develop system/indicators!Looking for a guy(s) skilled in coding and development, python or pine script. Let's test strategies, I have learned how to trade for 10 years, I lack faith. Started as a student. On graduating, I found ICT and I continue. I think using systems to test strategies would help. So a quant, sort of, with coding knowledge. No compensation on offer, just two (or more) guys and girls working out a way to beat the system and pave a way for themselves. I am M(30). Reach out, lubof!
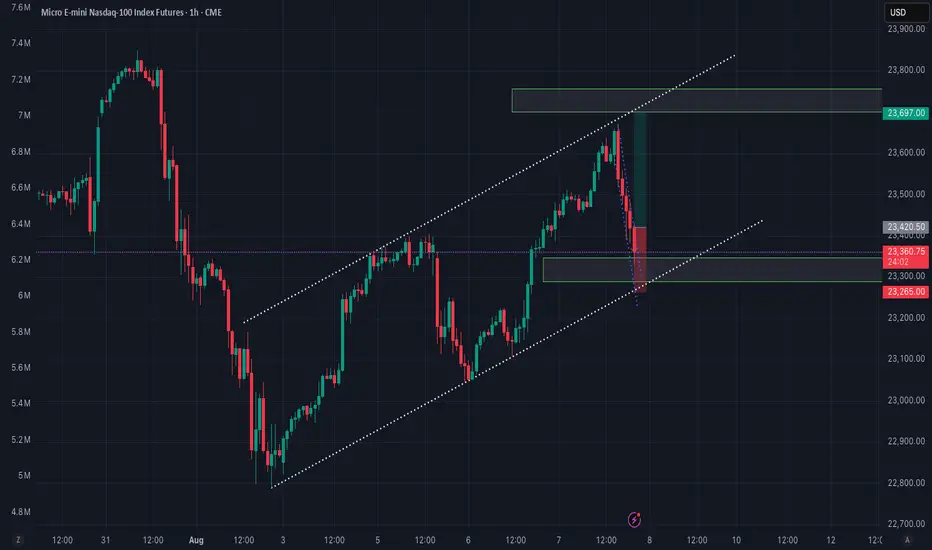
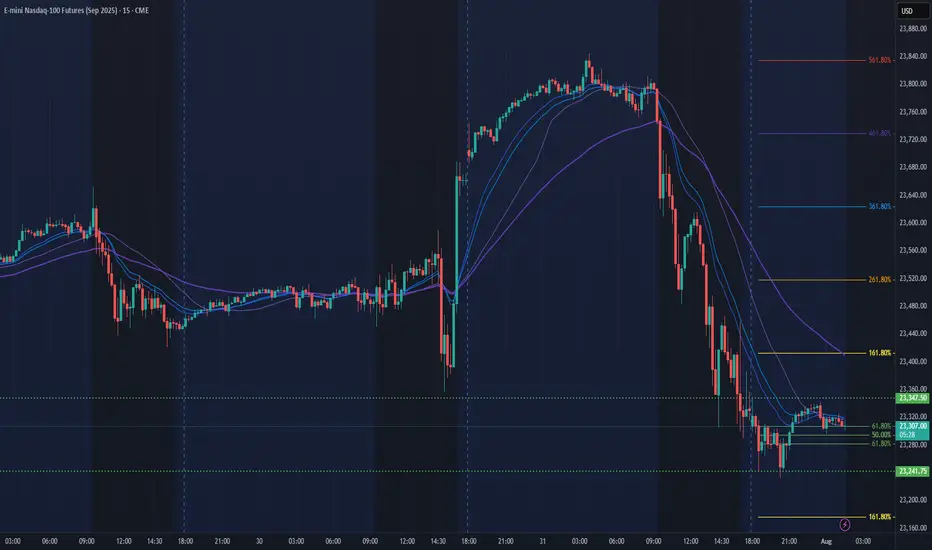
Nasdaq longPossible trade shaping up on the Nasdaq.
1hr trendline a channel with a 50-61.8% fib zone
Previous days profile providing a low volume node as support
5min counter trend failure for possible breakout point. Otherwise, previous lower high or resistance might be worth looking at
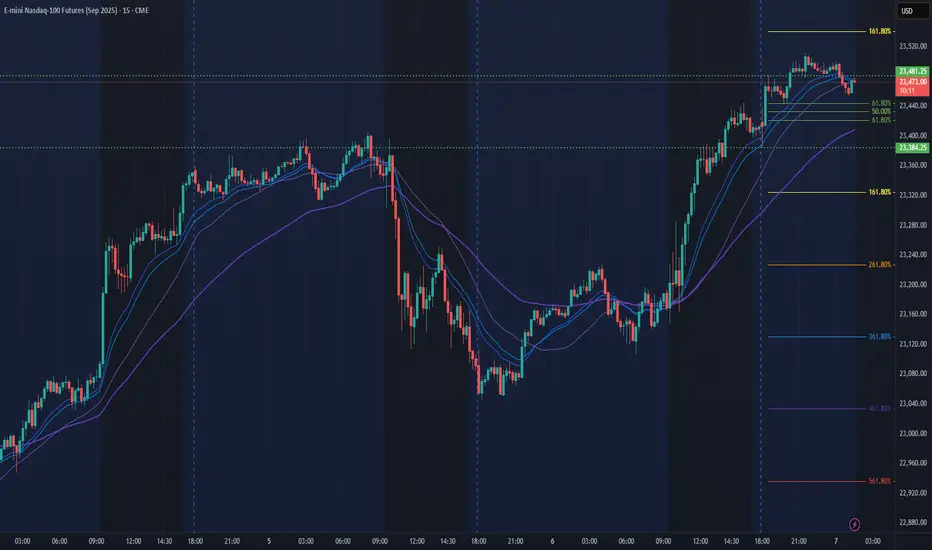
NQ Power Range Report with FIB Ext - 8/7/2025 SessionCME_MINI:NQU2025
- PR High: 23481.00
- PR Low: 23384.50
- NZ Spread: 216.25
Key scheduled economic events:
08:30 | Initial Jobless Claims
13:00 | 30-Year Bond Auction
Session Open Stats (As of 12:35 AM 8/7)
- Session Open ATR: 305.25
- Volume: 34K
- Open Int: 285K
- Trend Grade: Long
- From BA ATH: -1.5% (Rounded)
Key Levels (Rounded - Think of these as ranges)
- Long: 23811
- Mid: 22096
- Short: 20383
Keep in mind this is not speculation or a prediction. Only a report of the Power Range with Fib extensions for target hunting. Do your DD! You determine your risk tolerance. You are fully capable of making your own decisions.
BA: Back Adjusted
BuZ/BeZ: Bull Zone / Bear Zone
NZ: Neutral Zone
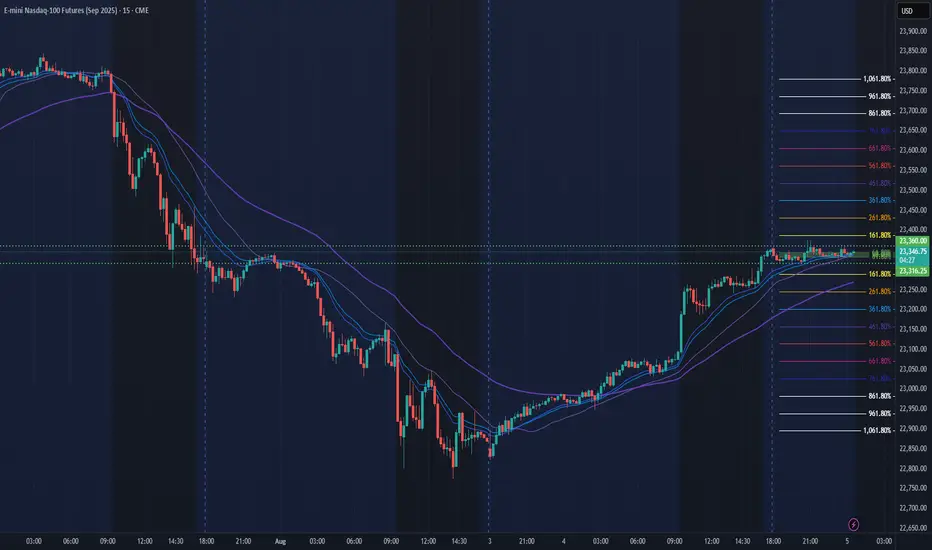
NQ Power Range Report with FIB Ext - 8/5/2025 SessionCME_MINI:NQU2025
- PR High: 23360.00
- PR Low: 23316.25
- NZ Spread: 97.75
Key scheduled economic events:
09:45 | S&P Global Services PMI
10:00 | ISM Non-Manufacturing PMI
- ISM Non-Manufacturing Prices
Session Open Stats (As of 12:35 AM 8/5)
- Session Open ATR: 294.27
- Volume: 23K
- Open Int: 278K
- Trend Grade: Long
- From BA ATH: -2.0% (Rounded)
Key Levels (Rounded - Think of these as ranges)
- Long: 23811
- Mid: 22096
- Short: 20383
Keep in mind this is not speculation or a prediction. Only a report of the Power Range with Fib extensions for target hunting. Do your DD! You determine your risk tolerance. You are fully capable of making your own decisions.
BA: Back Adjusted
BuZ/BeZ: Bull Zone / Bear Zone
NZ: Neutral Zone
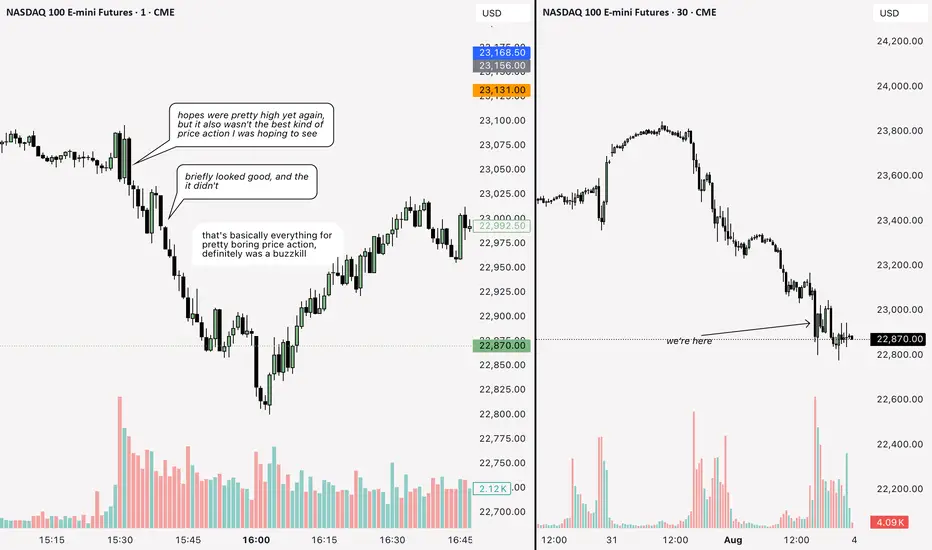
NQ: 230th trading session - recapReally good session today - won't be here tomorrow PROBABLY. I'll do a mental recap of the day after it's over. Again, I'm away for holidays. Maybe I should take the time off too. Maybe. Just maybe.

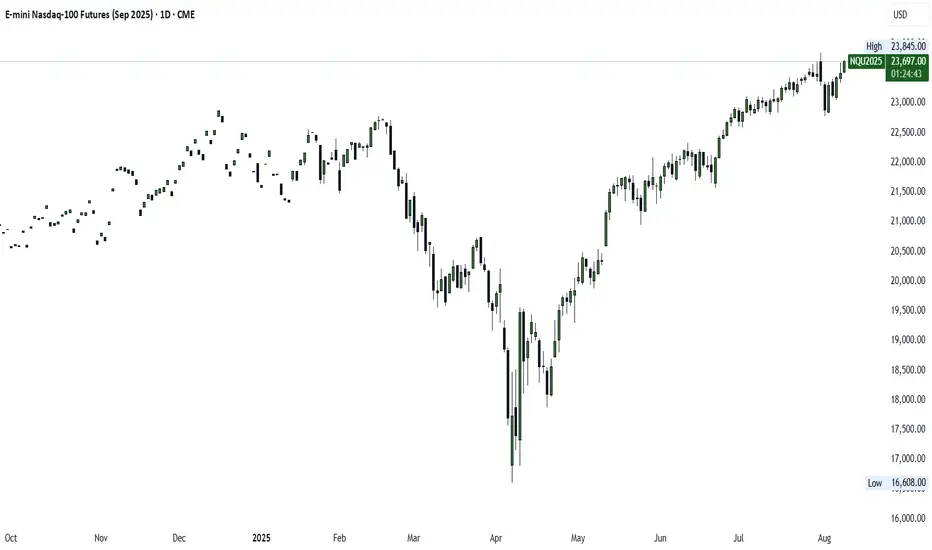
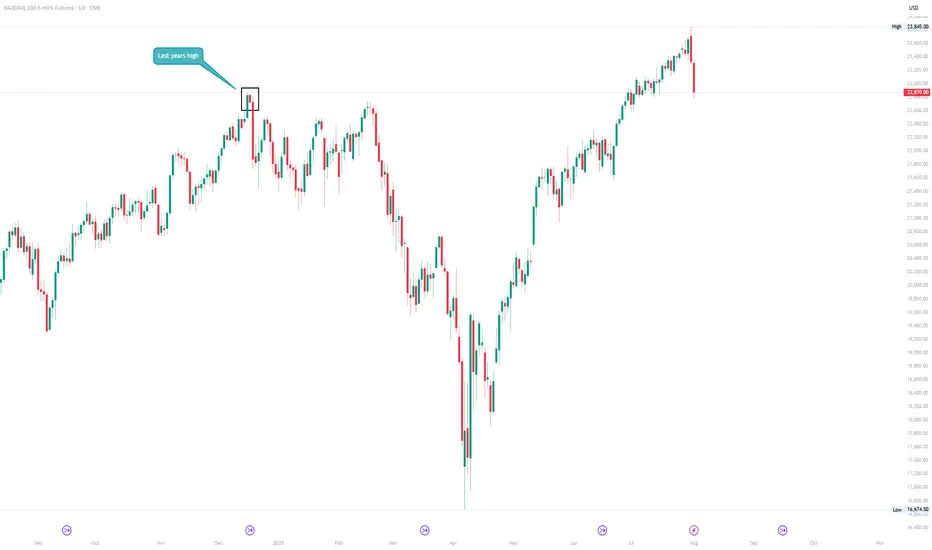
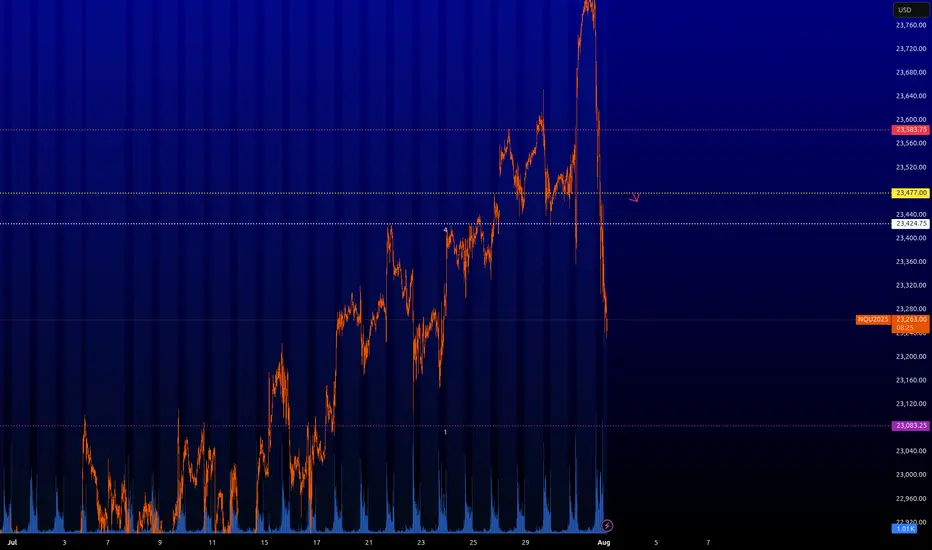
E-Mini Nasdaq Futures Markets Close at a Major Inflection PointAs the new month begins, the market just closed right at last year’s high, a critical level that could act as either resistance or new support.
These return-to-origin zones aren’t random. They often mark key decision points for institutional capital.
The question now:
Does this level hold as a launchpad, or does it reject?
What to watch :
VIX curve: contango or hedging pressure?
Bond market: confirming risk-on or signaling caution?
Breadth: is this rally broadening or narrowing?
No need to predict. Let price and flow do the talking.
See you on the inside. CME_MINI:NQ1!
NQ: 229th trading session - recapNot a good session, price action was bad and my focus also wasn't spot on.
I on vacation for a week. I might look into the markets cuz I have maybe some time.
But next week I'll definitely return with better focus - that's actually everything holding me back rn. My inability to lock in completely.
I've got my plan, I've got my system, I've got my funded accounts. Now I just need to focus.
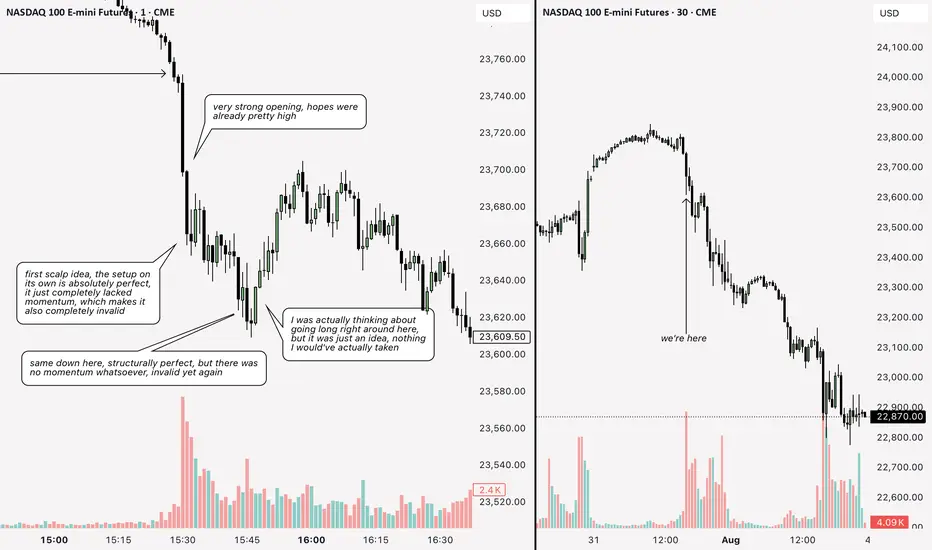
NQ: 228th trading session - recapI am posting this and fridays session very late. However with the benefit of hindsight (and what I actually thought a few days ago: I was not surprised seeing such a huge pullback/ bearish increase. I was actually talking about that in a few recaps a while ago. This is what I love about scalping man
Daily Orderflow on ES and NQ. 01.08.2025, NFP FridayCME_MINI:NQ1! CME_MINI:ES1!
Orderflow explanation. Sessional delivery and New York Price action

NQ Power Range Report with FIB Ext - 8/1/2025 SessionCME_MINI:NQU2025
- PR High: 23347.50
- PR Low: 23241.75
- NZ Spread: 236.0
Key scheduled economic events:
08:30 | Average Hourly Earnings
- Nonfarm Payrolls
- Unemployment Rate
09:45 | S&P Global Manufacturing PMI
10:00 | ISM Manufacturing PMI
- ISM Manufacturing Prices
Engulfing daily bar from ATH into new week lows
Session Open Stats (As of 12:45 AM 8/1)
- Session Open ATR: 262.82
- Volume: 45K
- Open Int: 280K
- Trend Grade: Long
- From BA ATH: -2.2% (Rounded)
Key Levels (Rounded - Think of these as ranges)
- Long: 23811
- Mid: 22096
- Short: 20383
Keep in mind this is not speculation or a prediction. Only a report of the Power Range with Fib extensions for target hunting. Do your DD! You determine your risk tolerance. You are fully capable of making your own decisions.
BA: Back Adjusted
BuZ/BeZ: Bull Zone / Bear Zone
NZ: Neutral Zone
NQ : Key levelsHere are the key levels that the market will be interested in. From the yellow level ~23.477 you can already look for shorting trades. However, I would be careful with shorts on US indices. The other levels are still risky for limit order trading.
⚠️ VOLATILITY WARNING ⚠️
Trading around major news can be extremely unpredictable. Trade responsibly!
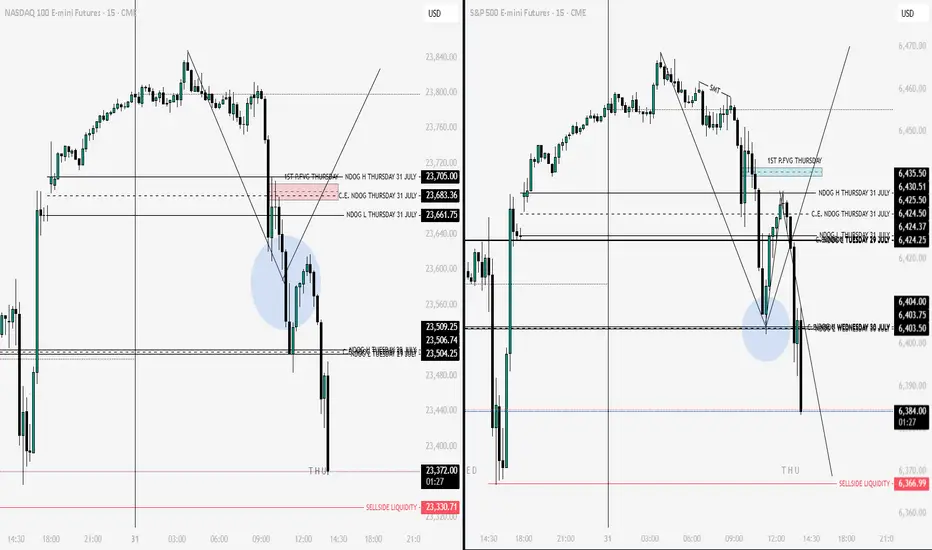
Nq & Es Key Levels 31-07 After PredictionsThe price resisted the point indicated before but the price did not continue upwards. Not good Analysis Today...
MNQ Short @robby.tradez price looking to fill imbalance from yesterdays late New York session
- what inspired the trade?
I run a checklist of confluences when trading this asset, it is either I compare it with CME_MINI:MES1! or DXY
as of now MNQ is below my daily open so it lets me know sellers are in control as well as using the volume profile gives me more confirmation, also pairing it with DXY then we have more reason why I took the trade \\
RR 1:4 I generally aim for 4% on a trade like this because it passes as a high probability trade A SETUP

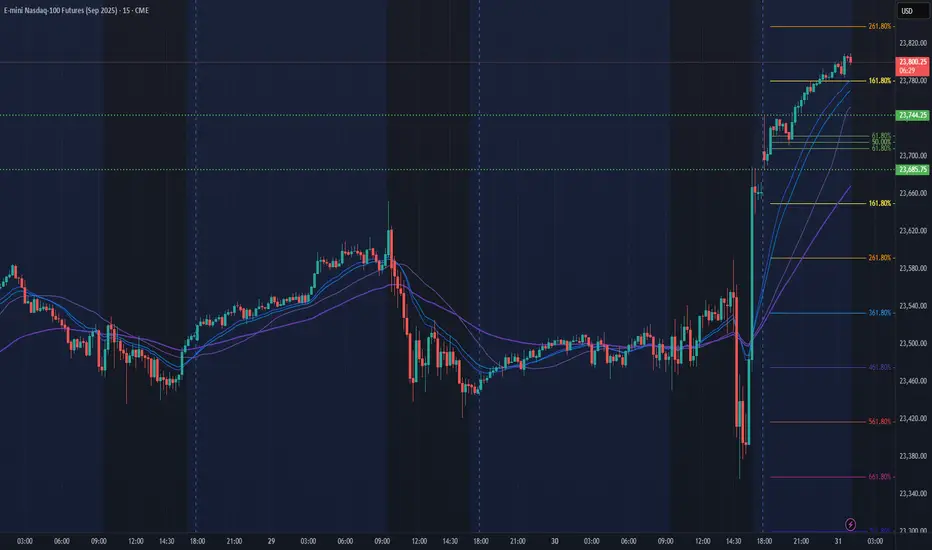
NQ Power Range Report with FIB Ext - 7/31/2025 SessionCME_MINI:NQU2025
- PR High: 23744.25
- PR Low: 23686.00
- NZ Spread: 130.5
Key scheduled economic events:
08:30 | Initial Jobless Claims
- Core PCE Price Index (MoM|YoY)
09:45 | Chicago PMI
New ATHs through Asian hours
Session Open Stats (As of 12:25 AM 7/31)
- Session Open ATR: 244.46
- Volume: 32K
- Open Int: 283K
- Trend Grade: Long
- From BA ATH: -0.6% (Rounded)
Key Levels (Rounded - Think of these as ranges)
- Long: 23811
- Mid: 22096
- Short: 20383
Keep in mind this is not speculation or a prediction. Only a report of the Power Range with Fib extensions for target hunting. Do your DD! You determine your risk tolerance. You are fully capable of making your own decisions.
BA: Back Adjusted
BuZ/BeZ: Bull Zone / Bear Zone
NZ: Neutral Zone
Nq & Es Key levels 30-07 Looking at my previous post regarding flat keys, I am horrified by the accuracy of the reversal and the evolution of price action today...