The Gold Retrace for Ultimate Entry!looking for price to continue with its pullback to find where exactly support is. Once we see price establish support we should get some type of signal for entry and price can continue with this bullish price action to make new highs. If we get a full 71.8% pullback that should make for a nice bull
Contract highlights
Related commodities

Gold and DXY. Day before CPI 14.07.2025, MondayExplaining about the thoughts on CPI. Expect major movements on GOLD

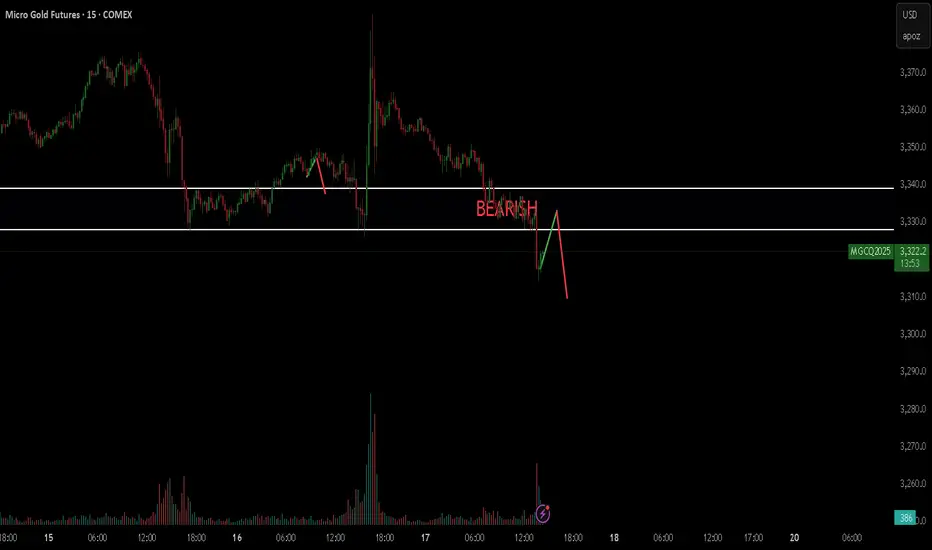
Twitter Speculation sent Gold FLIP Floppin!So yesterday there was a few Tweets that caused chaos in the market. Fed Rumors about Powell getting fired. Im still looking for my long. Waiting for a sweep on levels before getting active.


Gold LongsFollowing last weeks bias. Looking for REQH target.
Want to pair longs with a weekly profile. Ideally Monday or Tuesday creates the low of week. Will look to get onside with longs once theres a clear intraweek reversal. Trade the continuation higher. A close below 3320 is invalidation. Expecting pr

Gold is Setting up for another moveLooking for price to make some impulsive moves before we get active. Looking like they are trying to establish a low for the week before they go full on bullish. waiting for them to find that bottom.

This is a good video7.14 . 25 this is a great video because there are so many examples of patterns to look at and there weren't that many markets that I was following and about 3 or 4 of the markets actually had dramatic movement in the direction you would expect and this is an example of setting up your pattern and

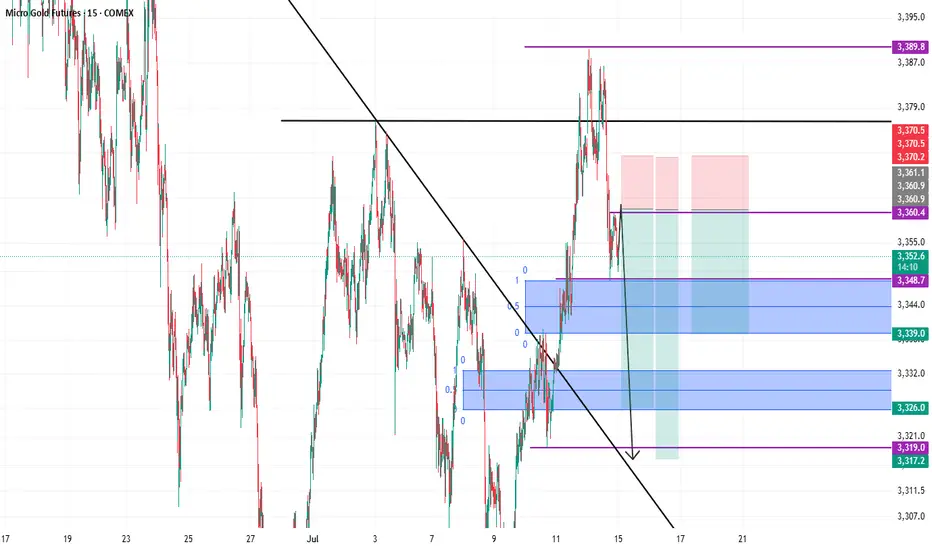
Shorting Gold again and againYep, Iam still thinking that gold should be shorted. Even though that i can see there is some huge liquidity up which should draw the money to it, but still on bigger timeframes, it shows weakness.
So here it is with targets. hopefully it goes through.
Good luck everyone.
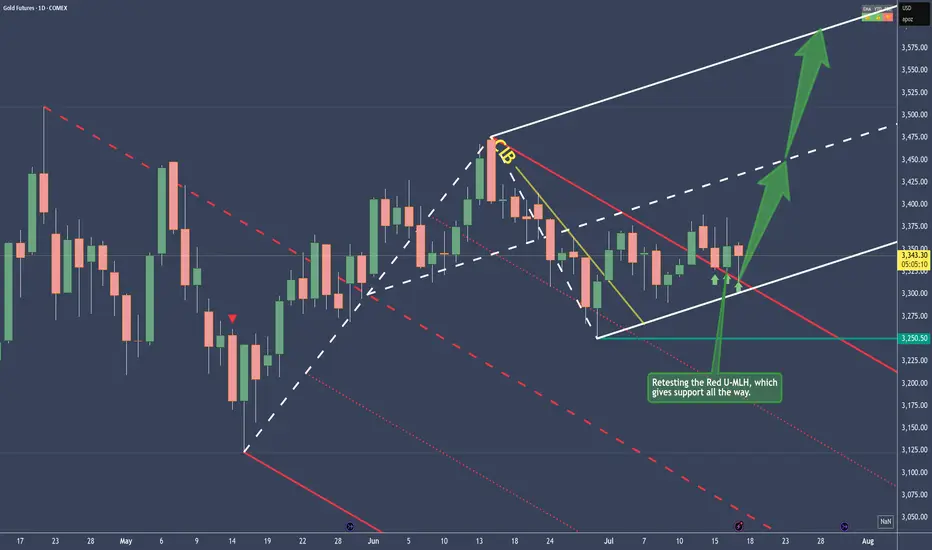
Gold - Bullish and here's whyPrice traveled within the Red Fork, until it broke the CIB Line, which is indicating a Change In Behavior.
From there on, sideways action, until the break of the Red U-MLH happened.
After the close above the Red U-MLH, price has tested it the 3rd time now. At the time of writing, the Bar looks lik
See all ideas
A representation of what an asset is worth today and what the market thinks it will be worth in the future.
Displays a symbol's price movements over previous years to identify recurring trends.
Frequently Asked Questions
The nearest expiration date for Gold Futures (Dec 2014) is Dec 29, 2014.
Traders prefer to sell futures contracts when they've already made money on the investment, but still have plenty of time left before the expiration date. Thus, many consider it a good option to sell Gold Futures (Dec 2014) before Dec 29, 2014.