FUTURES GOLD i LIKE THIS POTENTIAL SETUP. WE are at an area of supply. Price is consolidating. I would like to see price break below that support giving us the notion that price will only correct and sell back to those previous areas of support and I have marked out the tp targets as those areas we might see some strong rejection as price is still very bullish
GCF2021 trade ideas

Gold looks like it might be heading Higher6 12 25 this is a long video hopefully it does not fail to upload. I mentioned a number of markets in this includes some advice to one of my students ( there is only one student right now) and that's perfectly fine for me.... but I wanted her to see a couple of markets that she might not be looking at but her worth looking at if she wants to trade more markets. I did not include agricultural stuff which could be a good choice, but I just don't spend time with it.

$MGC(Gold) EW Recount. Two Possible scenarios!!! - June 11, 2025Hello fellow gamblers,
As you can see in the title, I had to do a recount of my EW analysis for gold since we did fail to break below support towards our Wave C target.
This video is a bit long because i bring 2 different scenarios that could be playing out at this time.
I hope you enjoy!
- Watching for price action behavior near the down trendline and watching for the FVG gap to hold support.
- Levels to watch: 3418.2, 3398, 3360.4, 3324

What is Gold Silver Spread?What is gold silver spread? How to understand them to determine the market direction.
Reuters mentioned that the gold-silver ratio dropped from 105 to 94. What does this mean? Does it indicate that silver is about to trend higher, or is it a sign that gold will continue its trend?
Micro Silver Futures
Ticker: SIL
Minimum fluctuation:
0.005 per troy ounce = $5.00
Disclaimer:
• What presented here is not a recommendation, please consult your licensed broker.
• Our mission is to create lateral thinking skills for every investor and trader, knowing when to take a calculated risk with market uncertainty and a bolder risk when opportunity arises.
CME Real-time Market Data help identify trading set-ups in real-time and express my market views. If you have futures in your trading portfolio, you can check out on CME Group data plans available that suit your trading needs www.tradingview.com
Trading the Micro: www.cmegroup.com
www.cmegroup.com

Get ready for the Breakout on GOLD!"you know how looong i been waiting for dis?!" *Gambit Voice*
Been waiting for this set up to happen and its slowly showing that its ready to break out and go for new Highs. just trying to be patient and ready for it.

Gold Futures – Double Top Leads to Bearish SetupGold Futures on the MCX chart is showing a classic Elliott Wave pattern in play. After forming a regular flat correction with a double top near the 99,300–99,200 zone, prices have started to drift lower. The double top structure—combined with the completion of Wave B—suggests that a Wave C decline is underway.
Wave A took the price down to around 90,890, followed by a corrective Wave B that failed to break the previous high convincingly.
The near-term outlook on the 4-hour timeframe remains bearish. I am anticipating five waves down within Wave C, which may take price back toward the previous Wave A low or slightly lower, possibly ending in a diagonal pattern, before a bullish reversal can be expected.
Disclaimer: This analysis is for educational purposes only and does not constitute investment advice. Please do your own research (DYOR) before making any trading decisions.

I'm Buying!Price will go above 3500 just don't know how much. I want to play safe, 1st target @3500. As our 2nd target accomplishes we'll take reverse position on the possible top.

New Highs for Gold = New bull RunHere it is!! the breakout I been talking about in my other updates. doing it on a Friday cause Israel is starting ish! Sitting this out cause it can get volatile.

Gold has filled in value I have been waiting to see...Looking for price to reverse from this area. Need confirmation for it first then get in on a pullback to continue.

Waiting for Gold to Set up for the next playPrice came to my zone. Now im waiting for them to do some sweeps before they show they ready to continue. Being it is Tuesday this week they might just go for a low for the week first.

$MGC (Gold) Pos-Market Update - June 11, 2025Huge moves happening on gold, price is now in a level in which it could invalidate our ABC scenario. At this moment, I'm not changing my bias. I would like to see a break above that 3397.5 level before that happens.
- Key levels: 3397.5, 3387.6, 3372.8, 3366.7, 3339.7


Gold Up?Gold might continue to go up even more, seems like a 4th wave in hourly
Price currently at a gap resistance, need to wait and watch what it does
4 Hourly Chart showed price taking a retest of trendline
Daily chart shows a clear ABC wave, possible all time high soon?

GC - Gold digging for a possible ShortAfter reaching WL2, we saw a sharp pullback followed by an immediate double top. Price failed to reach the centerline of the yellow fork, instead stalling at the 1/4 line.
Then came the break of the lower median line (L-MLH), a pullback to the white WL1—then the drop began.
If this market can’t push to new highs, we’ll likely fall back into the median line set. A pullback to the upper median line (U-MLH), as indicated by the red arrows, is a probable scenario.
Next stop: the white centerline.
I trade tiny. I trade with extremely high risk-reward setups. I’m fine getting stopped out all the time —because I’m hunting huge moves.
I don’t chase. No FOMO.
It’s how I sleep well, make money from trading and keep my stress level very low.

Gold Pullback Entry Opportunity Gold resumed its rally, sparked by recent tarrif news. Price is pulling back at the moment and has entered an sweet spot where we can confidently take our first low risk Buy.
BUYING HERE BECAUSE
1. We're entering into a low volume area, which is also in line with an FVG on the 1hr chart
2. When a new uptrend starts, i like to buy first 2 instances price pullback to bounce from my trend cloud indicator We didn't get a perfect bounce as it has broken below it, but i'am still buying regardless due to my first reason above about the low volume gap.
PROFIT TARGET
Setting my profit target to my trusted Exofade peak. As long as the uptrend continues, Exofade peaks will ALWAYS get taken out. That why i love this indicator, and its free. It's my gift to y'all :) . Just search for it in trading view indicators.

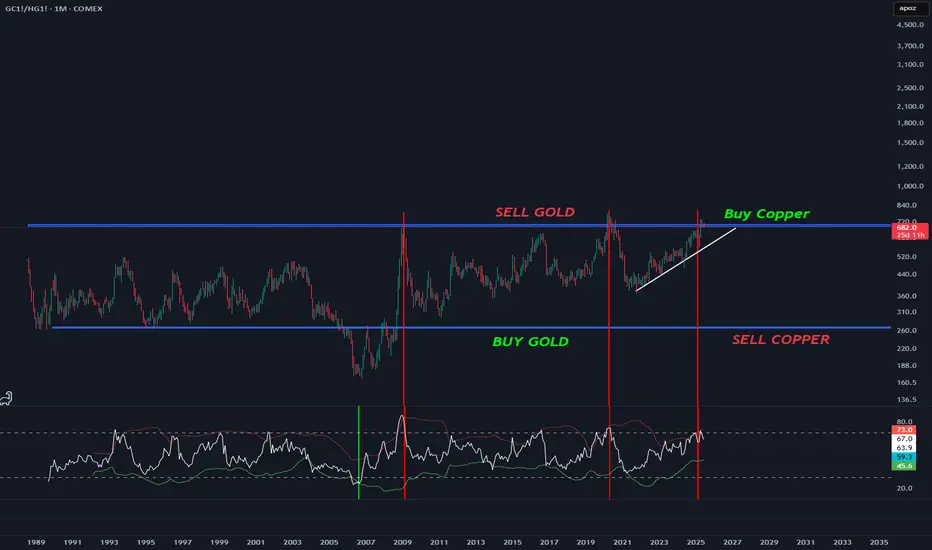
Time to SWITCH GOLD to COPPERHello. Good ? Me Yes, God you are my lord.
GOLD VS COPPER.
We are on the top. Copper will explode soon.
Be ready fokls.
If you want a safe entry : Break the white line.
LOW indicator : Time so sell...
Good luck.
STOCK era is over. Commodities will rise.
Scalp it or Swing it, but its bearish There is 65% chance that this trade would hit. Only time will tell though.
The upper trendline is bearish and it held for long, will whales manipulate the price and get the liquidity above then continue lower or the price will just hit lower? only time will tell.
I think maybe we will be visiting the 3000 again, hopefully soon.

gold Tesla ES versus the Russell and other markets November 2nd. gold looks bullish and may very well test the highs. I forgot to talk about silver as I was running out of time and that's trading very well and I will try to talk about silver tomorrow if I have time.

Short. range boundGold range bound. Possible fake out to the upside. This is just speculation. Do your own research.

Gold is Setting up for a Move! Could it be a big one?Looking for price to set up for a solid move. One thing is for sure we are waiting for the killzones before taking any action. The price action the last few days has been giving fake outs just before we roll into the killzone. Be patient. Wait for things to line up.

GOLD REVERESED! Looking for the breakout!We got some news Tuesday that shifted the direction of the pullback and now looking like we might just break out. if we can make it above yesterdays highs and closed on the H4 then I think it will be safe to look for higher levels. but if it breaks down from here then we could still see it reach for Liquidity. We just have to be patient in waiting for price to show its hand.

GOld trend directionGold 94790 is showing too congested volume pattern suggests aggressive distribution. We expect Gold will be back to its fair value 88000 to 60000 Zone ( Zone valid till Jan 26 )

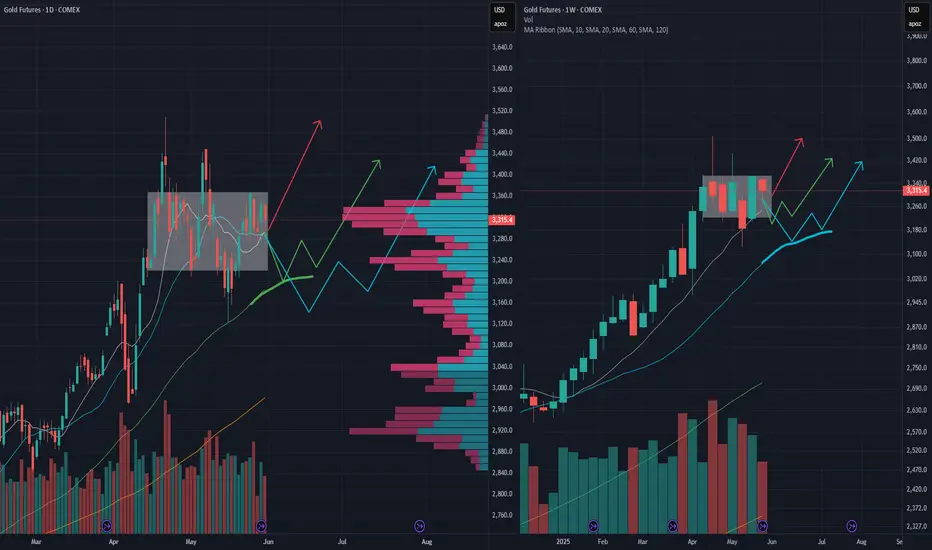
GC/GOLD bull rally setupHigh potential: looking for a 60 SMA support (~3200) in 2 weeks and then continue the bull rally (green path)
Medium potential: looking for a 20 weekly SMA support (~3140) in 1 month and then continue the bull rally (cyan path)
Low potential: directly break out next week (red path), but indicators do not quite support this case, so it may need some "external news"