Bearish drop?COPPER is reacting off the resistance level which is a pullback resistance that lines up with the 38.2% Fibonacci retracement and could drop from this level to our take profit.
Entry: 4.8781
Why we like it:
There is a pullback resistance level that lines up with the 38.2% Fibonacci retracement.
St
About CFDs on Copper
Copper is an essential industrial metal used worldwide. Copper prices are followed in financial markets around the globe and the metal is growing in popularity. Copper is widely used in construction and because of its electrical properties is found in wires and circuit boards. Copper is mined in open mines around the world, with Chile and the United States leading in overall copper production. The demand for copper is increasing as countries such as China and India continue to develop, while the supply remains tight. The growing demand and constrained supply is likely to keep copper prices volatile in the near future. Copper prices are commonly quoted in USD.

Bullish rise?COPPER has reacted off the resistance level which is an overlap support and could potentially rise from this level to our take profit.
Entry: 4.7862
Why we like it:
There is an overlap support level.
Stop loss: 4.7410
Why we like it:
There is a pullback support level.
Take profit: 4.8881
Why we l

Copper is SLOW but steady and climbing to the impossible 10,677The target seems like it's in another universe, but we are patient traders right?
Actually, this analysis is turning out to be a MEDIUM term investment.
The problem, with derivatives the Interest eats away daily and the price goes up technically.
However, the analysis is still on despite the sl

XCU/USD: Low-Risk Loot Opportunity!🔥 THE COPPER HEIST: XCU/USD Robbery Plan (Swing/Day Trade) 🔥
🌟 Attention, Market Robbers & Money Makers! 🌟
(Hola! Oi! Bonjour! Hallo! Marhaba!) 🤑💰💸✈️
Based on the 🔥Thief Trading Style🔥, here’s our master heist plan for the XCU/USD "The Copper" Metals Market! This is a high-probability long setup,

COPPER XCUUSDCopper Price Action, Dollar Correlation, Bond Yields, and Global Reserves
1. Copper Price Action and Dollar Index (DXY) Correlation
Inverse Relationship: Copper prices typically move inversely to the US Dollar Index (DXY). A weaker dollar (DXY↓) makes copper cheaper for foreign buyers, boosting dema

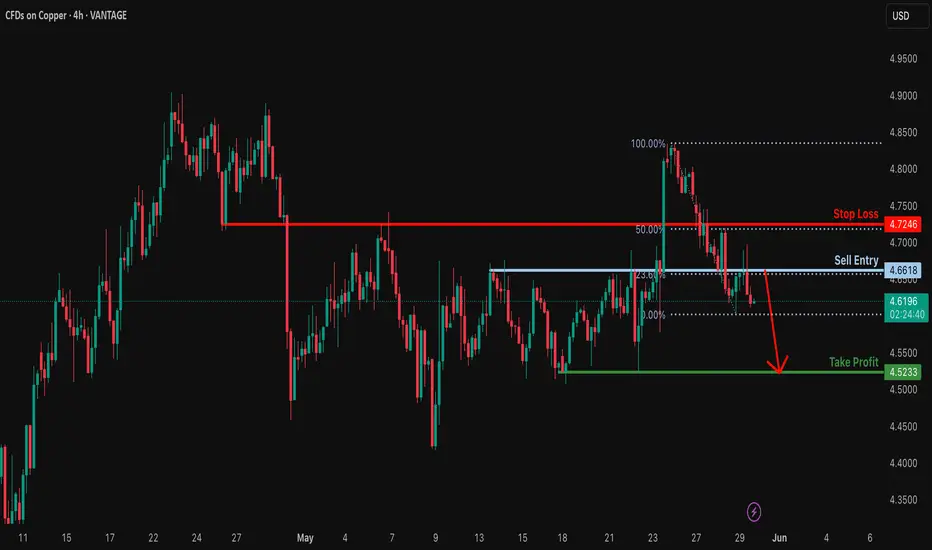
Bearish drop?COPPER has rejected off the resistance level which is a pullback resistance that lines up with the 23.6% Fibonacci retracement and could drop from this level to our take profit.
Entry: 4.6618
Why we like it:
There is a pullback resistance that lines up with the 23.6% Fibonacci retracement.
Stop lo
Copper Nears Breakout–Fundamentals and Technicals Both Say “Buy"Copper, often called “the metal with a PhD in economics”, is sending a clear message: we’re entering a new bullish era.
As of mid-May 2025, Copper is trading above $4.85 per pound, approaching the psychological $5.00 level — a key threshold that could trigger further upside momentum.
______________

Bearish reversal off pullback resistance?COPPER is rising towards the resistance level which is a pullback resistance that aligns with the 145% Fibonacci extension and could reverse from this level to our take profit.
Entry: 4.8773
Why we like it:
There is a pullback resistance level that lines up with the 145% Fibonacci extension.
Stop

Analyzing Copper Prices Using Fibonacci ExtensionCopper, often referred to as "Dr. Copper" due to its ability to forecast economic trends, remains one of the most critical commodities in the global market.
Traders and analysts often use technical tools to forecast price movements, and Fibonacci extensions are one such tool. After testing the fir

Ready to Rob the Copper Market? XCU/USD Heist Plan Revealed!🌍 Hello Global Traders! 🌟
Money Makers, Risk Takers, and Market Shakers! 🤑💸✈️
Dive into our XCU/USD "Copper" Metals Market heist, crafted with the signature 🔥Thief Trading Style🔥, blending sharp technicals and deep fundamentals. Follow the strategy outlined in the TradingView chart, focusing on a l

See all ideas
Displays a symbol's price movements over previous years to identify recurring trends.