DIA: Falling Wedge Bullish Breakout Confirmed (295% - 545% Pot.)My dear reader, here we have a pair that is going bullish for the first time in years... DIABTC.
The relevant pattern for this pattern is the falling wedge. The falling wedge is a bullish reversal pattern and tends to show up at the bottom of a trend.
The bearish trend is long and wide. The fallin
Related coins

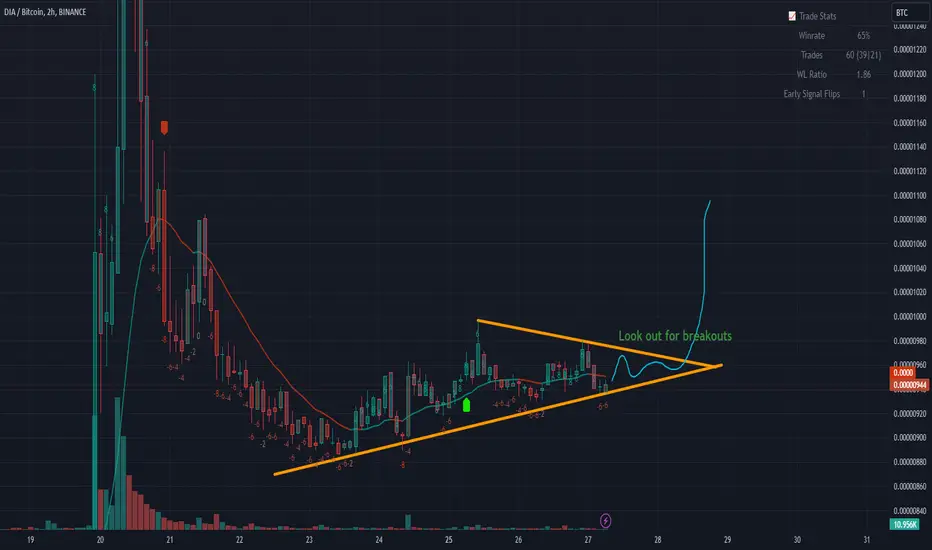
DIABTC ascending triangle, breakout soonHi there, DIA/BTC is forming an ascending triangle that signals bull run soon, keep an eye for that one for breakouts for long.
Entry at 0.00000940 seems fine, if we get breakout of this triangle we may reach 0.00001080 in a first run, possible even higher if market allows it.
As always use stop l
DIA trend reversal (inverse hammer)We can see DIA has gained some strength in the last 24 hours vs BTC. Also while btc dropped dia went up. This W shape recovery may play out.
-Targets on chart
-Signals on chart

$DIA trying to reclaim level lost since may
DEGO pumped maybe this is the next D to move
invalidation below 200

$DIA broke out rejected from supply zone
most likely retest of break out zone then proceed to flip yellow line for continuation
weekly stoch just crossed to the up side and H4 and daily bullish

$DIA/$BTCprepare for explosion.
I think we are in an arc and from it's base we are going to shoot upwards


$DIA/BTC 2D (Binance Spot) Bug falling wedge on supportDecentralised Information Asset looks bottomed here, we expect that dip to be the last then finally start the reversal.
Current Price= 0.00002656
Buy Entry= 0.00002665 - 0.00002405
Take Profit= 0.00004054 | 0.00005321 | 0.00007541
Stop Loss= 0.00001927
Risk/Reward= 1:2.5 | 1:4.58 | 1:8.23
Expected

DIA formed bullish Gartley | A good long oppottunityHi dear friends, hope you are well and welcome to the new trade setup of DIA token with BTC pair.
On a 4-hr time frame, DIA has formed bullish Gartley pattern.
Note: Above idea is for educational purpose only. It is advised to diversify and strictly follow the stop loss, and don't get stuck with

DIA What is the next ?!Someone buys quantities of currency, as an accumulation for periods of time that spanned more than a month
Maybe we will see soon
200% or more !

See all ideas
Summarizing what the indicators are suggesting.
Oscillators
Neutral
SellBuy
Strong sellStrong buy
Strong sellSellNeutralBuyStrong buy
Oscillators
Neutral
SellBuy
Strong sellStrong buy
Strong sellSellNeutralBuyStrong buy
Summary
Neutral
SellBuy
Strong sellStrong buy
Strong sellSellNeutralBuyStrong buy
Summary
Neutral
SellBuy
Strong sellStrong buy
Strong sellSellNeutralBuyStrong buy
Summary
Neutral
SellBuy
Strong sellStrong buy
Strong sellSellNeutralBuyStrong buy
Moving Averages
Neutral
SellBuy
Strong sellStrong buy
Strong sellSellNeutralBuyStrong buy
Moving Averages
Neutral
SellBuy
Strong sellStrong buy
Strong sellSellNeutralBuyStrong buy
Displays a symbol's price movements over previous years to identify recurring trends.