Strategies to Save Capital and Thrive in Bear MarketsEver felt stuck in a downtrend, unsure how to protect your capital?
Most traders burn their portfolios in bear markets just because they lack a real escape plan.
In this analysis, you'll uncover little-known strategies that could literally rescue your investments.
Hello✌
Spend 3 minutes ⏰ reading this educational material.
🎯 Analytical Insight on Dogecoin:
If Dogecoin fails to gain at least 20% in the next two weeks—while Bitcoin continues to rally—this divergence could signal a broader market weakness. When BTC outperforms and altcoins lag, it often reflects declining risk appetite and potential capital rotation out of speculative assets. A move toward the $0.27 target is key for confirming bullish continuation across the altcoin sector. 📉
Now , let's dive into the educational section,
🔧 TradingView Tools to Hunt Opportunities in Bear Markets
In bearish conditions, most traders only stare at price movements. But smart ones go deeper. With the right TradingView tools, you don’t just survive a bear market—you exploit it. Here are some must-use tools that can change your game:
Volume Profile: This helps highlight where trading activity is concentrated. These zones often act as hidden support in bearish phases.
Fixed Range Volume Profile: Use this to scan specific chart segments to understand volume-based zones of control. Perfect for pinpointing possible rebounds.
Auto Fib Retracement: TradingView’s automated Fibonacci retracement tool helps identify pullback levels. A critical asset when timing entries during downtrends.
Divergence Detector: Combine RSI or MACD to catch bullish divergences—these subtle signs often come before a trend reversal.
Multi-Timeframe S/R Indicator: This reveals support and resistance levels across different timeframes. Knowing where multiple levels align helps predict strong reactions.
For practical use, open a BTC or ETH chart, apply these tools, and look for volume clusters, divergences, and Fibonacci confluences. The more layers you add, the stronger your edge becomes. TradingView isn’t just a charting platform—it’s your bear market radar .
📉 Understanding Bear Market Psychology
Bear markets are all about fear and exhaustion. But that doesn’t mean opportunity is gone. If you learn to read the crowd’s psychology, you’ll see it’s just a phase—one you can use to your advantage.
🛡️ Capital Protection Comes First
Rule one in bear phases: protect, not profit. Logical stop-losses, reducing position sizes, using stablecoins, and cutting emotional trades are your survival kit.
🧲 Catching Opportunities in Pullbacks
Even bearish trends have bounces. These are golden moments to take short-term trades or exit from poor positions. The 4H chart with Fib retracement is your best friend here.
🔄 Range Trading = Consistent Gains
Sideways movement = scalping zone. Once price enters a range, clearly marked support/resistance levels from your indicators give sniper-level entries and exits.
🔮 Reverse Market Sentiment Like a Pro
In bear markets, everyone’s scared. Which means smart money starts buying. Flip your emotional lens. Fear on the street = quiet opportunity for the patient.
📊 Indicator Fusion for Early Signals
RSI + MACD + Volume = market whisperers. If RSI bottoms while volume spikes, you’re probably seeing the quiet before a bullish storm. Most won’t notice. You will.
🧬 Learn From the Past Market Cycles
History repeats. Mark previous bear market lows on your chart. Compare price action. Similar structure = similar outcome. Patterns from BTC 2018 or COVID crash are still valid today.
🧠 Your Mindset Is Your Strongest Tool
More than any tool or strategy, it’s your mental control that saves capital. If you can master your thoughts, you can master your trades. Bear markets punish the weak-minded—not just the unskilled.
🧭 Final Thoughts:
If you take away just one insight, let it be this: in bear markets, survival is the goal, and hidden opportunities are born from fear. No trend lasts forever. But the prepared trader lasts through every trend.
always conduct your own research before making investment decisions. That being said, please take note of the disclaimer section at the bottom of each post for further details 📜✅.
Give me some energy !!
✨We invest countless hours researching opportunities and crafting valuable ideas. Your support means the world to us! If you have any questions, feel free to drop them in the comment box.
Cheers, Mad Whale. 🐋
DOGEUSDT trade ideas

#DOGEUSDT: Targeting $2 By End Of The Year| Comment Your Views|DOGEUSDT stands as one of the most significant cryptocurrency pairs, yet its price has experienced substantial consolidation within a defined range, presenting challenges for trading and investment. However, we posit that the current price juncture holds the potential for a reversal, and we anticipate that by the end of the year, DOGEUSDT will reach approximately $2. In the interim, we recommend targeting smaller price ranges rather than aiming for $2, which may require months or even years to attain.
We extend our best wishes for your trading endeavours. It is imperative that you conduct your own analysis prior to making any investment decisions, as this does not guarantee any potential price movement.
If you’re feeling inspired by our content, we’d love to hear from you! Just give it a like, comment, or share your thoughts. It means the world to us!
Cheers,
Team Setupsfx_

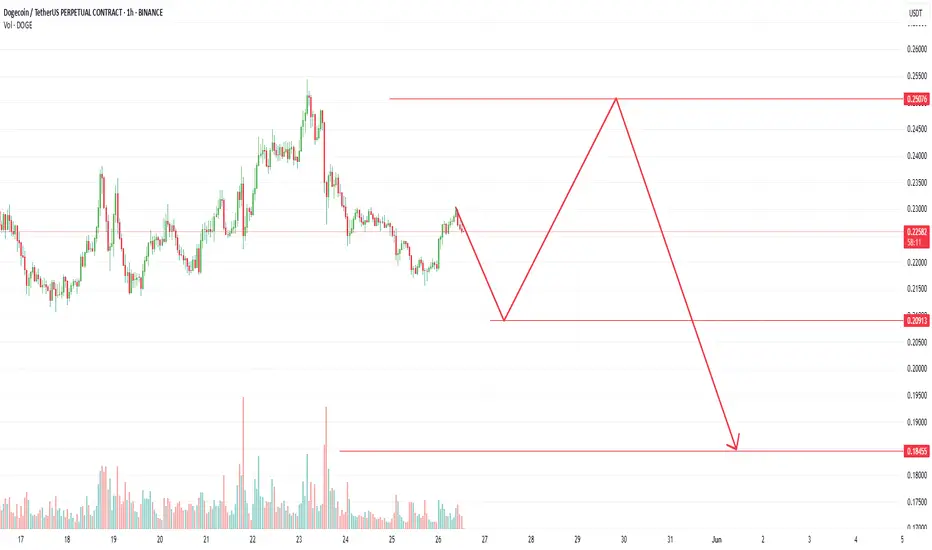
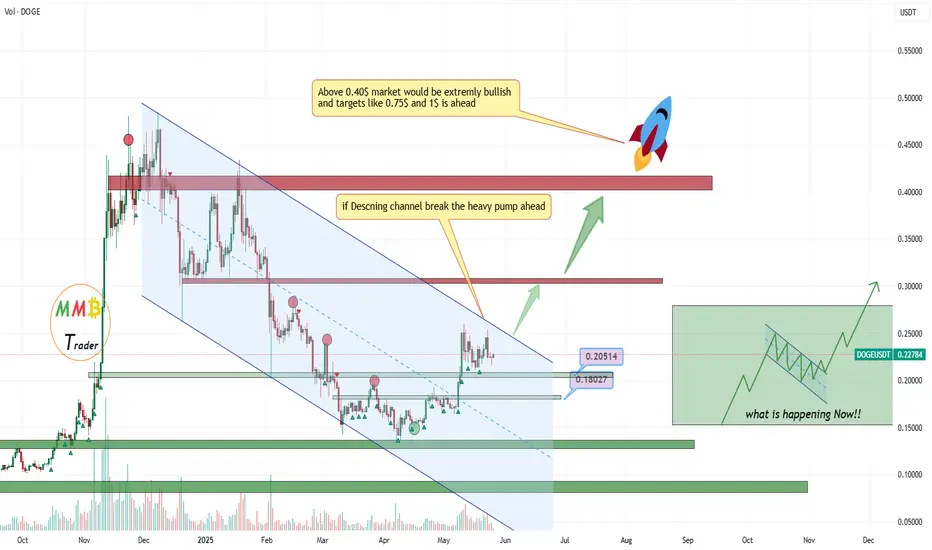
DOGEUSDT Above channel resistance will pump non stop get readyAs we can see price is getting ready for a breakout to the upside which cause DOGEUSDT pump non stop and even maybe will lead DOGE to new ATH.
All is needed which will happen soon is price break blue channel resistance and price above 0.27$ is sign of that.
DISCLAIMER: ((trade based on your own decision))
<<press like👍 if you enjoy💚
Lingrid | DOGEUSDT Corrective Move Completed. Possible LongThe price perfectly fulfilled my last idea . BINANCE:DOGEUSDT just printed a higher low on the ascending channel support, bouncing off the 0.188–0.190 zone. The prior A-B-C pullback is fading, and early bullish signals are showing above 0.192. If buyers regain control, the price could target 0.215 resistance as momentum rebuilds. Structure remains bullish while above the trendline and support block.
📈 Key Levels
Buy zone: 0.187–0.190
Buy trigger: reclaim of 0.195 with bullish confirmation
Target: 0.215
Sell trigger: breakdown below 0.187
💡 Risks
A breakdown below the higher low invalidates the setup
Consolidation under 0.195 may delay breakout
A sharp BTC drop could weaken this bullish scenario
Traders, if you liked this idea or if you have your own opinion about it, write in the comments. I will be glad 👩💻

DOGE Poised To Resume The Bullish TrendDOGE Poised To Resume The Bullish Trend
Dogecoin is forming an inverse head and shoulders pattern, a classic signal of a possible trend reversal.
In this case, it’s a short-term setup due to its smaller scale on the chart.
If the price breaks above the neckline, the chances of a renewed bullish wave increase, setting the stage for potential upward movement, as reflected in the chart.
Key targets: 0.2390 | 0.2500
You may find more details in the chart!
Thank you and Good Luck!
❤️PS: Please support with a like or comment if you find this analysis useful for your trading day❤️

Dogecoin Bearish (BD) but Bullish (BU)You see, Dogecoin is bearish but this bearish is only short-term. This retrace can last a few days more and then the market will turn and start growing again. In the worst case scenario, the drop can extend and last one or two weeks, that's it. Nothing more.
So, what does it matter if it goes down short-term when it will grow in the long haul.
See the pattern on the chart and the rising trendline at the bottom. This is the main support. The bullish structure will remain intact, the market is adapting because obviously, too much leverage can never work.
Once the over-leverage is removed from the market, we resume growing and this resumption is just around the corner. Next week or the week after, it doesn't matter, we are going higher.
Namaste.

DOGEUSDT → Long squeeze before growth?BINANCE:DOGEUSDT.P is consolidating. A range with clear boundaries has formed. Before a possible breakout, a liquidation (false breakdown) may form
On D1, the structure is quite positive. Earlier, the price tested the downward resistance, but there was no reaction (fall) as such. Instead, the price is consolidating within the range of 0.211 (0.205) - 0.23 - 0.253.
Bitcoin, like the entire crypto market, is consolidating within fairly clear boundaries. Based on the current situation, it would be logical to wait for one part of the market to be liquidated before the price can move in either direction. Based on the bullish market, there may be a retest of support in the form of a false break...
Resistance levels: 0.2308, 0.253
Support levels: 0.213, 0.2116, 0.205
DOGE is consolidating with a focus on the 0.23–0.211 range. Against the backdrop of a bullish trend, a liquidation (long squeeze) relative to the lower boundary of the 0.23–0.205 range is possible before growth continues. A false break of support and liquidity capture would be useful maneuvers before implementation. However, if the market is aggressive enough and resistance at 0.23 is broken with subsequent consolidation above this level, it could trigger premature growth.
Best regards, R. Linda!

DOGE Ready for PUMP or what ?I might be wrong , but it might come true From a technical perspective!!!
Give me some energy !!
✨We spend hours finding potential opportunities and writing useful ideas, we would be happy if you support us.
Best regards CobraVanguard.💚
_ _ _ _ __ _ _ _ _ _ _ _ _ _ _ _ _ _ _ _ _ _ _ _ _ _ _ _ _ _ _ _
✅Thank you, and for more ideas, hit ❤️Like❤️ and 🌟Follow🌟!
⚠️Things can change...
The markets are always changing and even with all these signals, the market changes tend to be strong and fast!!

still have hope for doge??it seems we have inside shark harmonic pattern.
also we probably have complete 5 wave of elliot that we can expect doge go up to at least target 1.
what is your opinion?

$DOGE At Key Support Reversal Ahead?The DOGEUSDT 1D chart shows price testing a strong support zone around $0.18–$0.19.
If this level holds, a bullish reversal could push DOGE toward the $0.32 resistance area.
The setup suggests a potential uptrend with higher highs, but a breakdown below support may invalidate this move.
DYRO, NFA

A sweet dream that will most likely come true.This is the best thing that has happened to the Dogecoin community. This cup pattern has generally worked.

Dogecoin (DOGE): Re-Testing Broken Zone of EMAs (200&100)Seeing Dogecoin back at EMAs, where price is retesting the broken zone, upon successful retest, we should see a good upward movement.
But we do not yet have the successful re-est so we will wait for buying volume to build up and our buy zone to be reached, but if we see that sellers will overtake current zones, then we are going to go for downward movement, which can send the price as low as $0.14-$0.15.
Swallow Academy

DOGE/USDT Potential UpsidesHey Traders, in today's trading session we are monitoring DOGE/USDT for a buying opportunity around 0.22000 zone, DOGE/USDT is trading in an ascending channel and currently is in a correction phase in which it is approaching the ascending channel support.
Trade safe, Joe.


DOGE: Setting Up for a Bounce?Eyeing a potential reaction at the 100% Fibonacci retracement of the recent 3-wave correction.
Entry: ~0.2080
Stop: ~0.1800
T1: ~0.2340
T2: ~0.2980
NFA

Dogecoin (DOGE): Keeping Eye on 200EMA | Looking For BounceDogecoin is still hovering above the 200EMA, where we see some kind of weakness but the price still remains above the line so we are keeping our bullish game plan still active.
We are looking for a bounce on daily timeframe from 200EMA where we will be looking at $0.25 for a proper breakout, which then would send the price as high as $0.37
Swallow Academy

DOGE VS XRP | Which one has a better situation in 2025DOGE/XRP is currently showing signs of a potential bullish reversal after bouncing from a strong historical support zone around 0.075–0.085. The price has formed a possible higher low and is attempting to push above the 0.10 resistance level. Increasing volume at the bottom and improving structure indicate growing buying pressure.
Both RSI and MACD suggest early bullish momentum. RSI appears to be recovering from oversold conditions, and MACD likely shows a recent bullish crossover. If price breaks and holds above 0.12, it could open the way toward 0.16 and 0.21. A failure to break resistance, however, could result in another retest of lower support.

DOGE Analysis (4H)It appears that Dogecoin's correction has started from the point where we placed the red arrow on the chart. This correction seems to be a flat pattern, with the first two parts forming a diametric and a triangle.
If the price reaches the green zone | which is a key area | we can start looking for buy/long positions.
Targets : 0.23092 _ 0.25283 _ 0.29426 _ 0.32217
A daily candle closing below the invalidation level will invalidate this analysis.
For risk management, please don't forget stop loss and capital management
Comment if you have any questions
Thank You

doge buy midterm"🌟 Welcome to Golden Candle! 🌟
We're a team of 📈 passionate traders 📉 who love sharing our 🔍 technical analysis insights 🔎 with the TradingView community. 🌎
Our goal is to provide 💡 valuable perspectives 💡 on market trends and patterns, but 🚫 please note that our analyses are not intended as buy or sell recommendations. 🚫
Instead, they reflect our own 💭 personal attitudes and thoughts. 💭
Follow along and 📚 learn 📚 from our analyses! 📊💡"

DOGECOIN SHORTDogecoin is currently on a good path. It has a bright future and will grow significantly in the next two years.
One of the principles of trading is patience. Sometimes not buying is the same as profit.
Considering the state of Bitcoin and the possibility of its decline, we will wait for it to reach a good support level

Fake Candle: Stop Getting Liquidated TodayA giant green candle pops up on your chart… You get excited, jump in — and boom, price dumps !
Fake candles are one of the market’s most psychological traps .
This breakdown shows how to avoid getting tricked — and even profit from them!
Hello✌
Spend 3 minutes ⏰ reading this educational material.
🎯 Analytical Insight on Dogecoin:
Dogecoin has posted an impressive 60% rally in recent weeks and is now testing the key psychological resistance at $0.25. A confirmed breakout from this level could unlock at least 22% further upside , aligning with a breakout above the descending channel toward the $0.28 target. Key daily support, Fibonacci confluence, and a rising trendline are also in play. 📉🚀
Now , let's dive into the educational section,
🧠 The Psychology Behind Candle Traps
It all starts when the market shows a sudden sharp move. A strong bullish candle — full of hope — shows up out of nowhere. But guess what? Most of the time, it’s just bait.
Smart money loves this moment — when retail traders think a moonshot is coming.
So never trust the candle’s look alone. Look deeper for confirmation.
🛠 TradingView Tools to Catch Fake Candles📊
practical tools inside TradingView that help detect false signals.
Set these up and test them live in your charting flow:
Volume Profile
Shows you where volume is really happening. No volume = no trust.
Session Volume HD
Reveals hidden session volume. If a big candle has weak session volume, that’s a red flag.
Relative Volume (RVOL)
Tells you if current volume is above/below normal.
Fake candles often come with volume mismatch.
Candle Close Timer
Shows how long until a candle closes.
Wait for that close — fake candles often flip last minute.
Multiple Timeframe Analysis
Check higher TFs before trusting the move.
Many fake candles trick you in low TFs.
Apply these directly inside your TradingView layout — it’s a game changer.
🔍 Real Candle vs Fake Candle
A real candle usually forms at a key support/resistance level with solid volume.
A fake one? Often pops up in a random zone, low volume, and before higher timeframes confirm.
Pro tip: Wait for the candle to fully close — then check if volume + structure supports the move.
📉 Rookie Mistake Alert
New traders often jump in on the first big candle they see.
Why? Because they want to be “early” and catch the move.
But in markets, patience wins — not speed.
Follow footprints, not fireworks.
🎯 Three-Step Filter For Fake Candles
Here’s your anti-fake-candle checklist:
No volume? No entry!
Confirmation over assumption. Use indicators like RSI, divergence, or MAs.
Always check the higher timeframe. Low TF = high deception.
🔄 Market Makers Love These Games
Fake candles are a classic weapon for market makers.
They know exactly when emotional traders will FOMO in.
These aren’t just candles — they’re emotional traps.
Study the trap, not just the move.
🧩 Final Takeaway & Suggestion
Fake candles aren’t just technical — they’re psychological .
Use the right tools, wait for confirmation, and don’t let your emotions lead .
Start your next analysis with a mental filter , not just a visual one.
always conduct your own research before making investment decisions. That being said, please take note of the disclaimer section at the bottom of each post for further details 📜✅.
Give me some energy !!
✨We invest countless hours researching opportunities and crafting valuable ideas. Your support means the world to us! If you have any questions, feel free to drop them in the comment box.
Cheers, Mad Whale. 🐋

DOGECOIN Eyes Major Breakout – Trend Channel in Controlhello guys!
doge seems potential now!
DOGECOIN has successfully broken out of a long-standing bearish trendline and is now respecting a well defined ascending channel structure.
After a clean retest of both the midline and the demand block around 0.1950–0.2150, the price is showing renewed bullish pressure. As long as price holds above this key support zone, we can expect further continuation to the upside.
what I see:
✅ Breakout of descending trendline confirmed
✅ Strong structure support from the demand block (0.1950–0.2150)
✅ Clean reaction from channel midline
✅ Momentum currently favors continuation of the bullish trend
🎯 Bullish Targets:
TP1: 0.2530 (recent swing high)
TP2: 0.2750 (channel upper boundary)
TP3: 0.3035 (major horizontal resistance zone)
🛑 Stop-loss idea: Below 0.1950 (invalidates bullish structure)

Doge magic chartHello,
These are pure speculative levels, and these predict essential patterns, assuming the price action repeats itself.