EGCH: Building Momentum – Eyes on the Next Move!“EGCH is setting up for a potential move with strong momentum and a bullish structure. Watching for a key reaction around the 8.40–8.50 EGP zone, where buyers could step in for continuation. If strength holds, upside potential toward 9.20–9.50 EGP is on the table. A breakout above 8.80 EGP with volu
Next report date
—
Report period
—
EPS estimate
—
Revenue estimate
—
2.54 B EGP
6.53 B EGP
578.36 M
About EGYPTIAN CHEMICAL INDUSTRIES (KIMA)
Sector
Industry
CEO
Mohamed Hassan Hegazy Abdel-Majeed Mohamed
Website
Headquarters
Aswan
Founded
1956
ISIN
EGS38201C017
FIGI
BBG000BM5YS8
Egyptian Chemical Industries engages in the production of chemicals, fertilizers, and related products. Its products include ammonium nitrate, ferrosilicon alloy, liquid ammonium, prill ammonium nitrate fertilizer, nitrogen and oxygen gas, liquid and aqua ammonia, nitric and hydrochloric acid, and silica fume. The company was founded on March 22, 1956 and is headquartered in Aswan, Egypt.

EGCHjust noticed this valid short right now.
I have no information about the stock or the company behind it, also i didnt follow the news today or anything related to this coin. So this is only TA analysis opportunity

EGCH ( what happened ???? ) What's Happening with Kima Stock (EGCH) on the Egyptian Exchange
Kima stock is one of the constituents of the EGX70 index on the Egyptian Exchange.
Phase One (August to September 2024):
The EGX70 index rose from 6200 points in August 2024 to 7028 in September 2024, a 13.35% increase. Similarly, Ki

Kima Egypt should target 11Daily chart, the stock EGX:EGCH is preparing to cross the resistance zone 9.1 - 9.2
Trading above 9.2 for 2 days, the target will be 11 then 11.6 passing through a resistance zone at 10
MACD indicator is positive.
Stop loss below 8.8 should be considered.

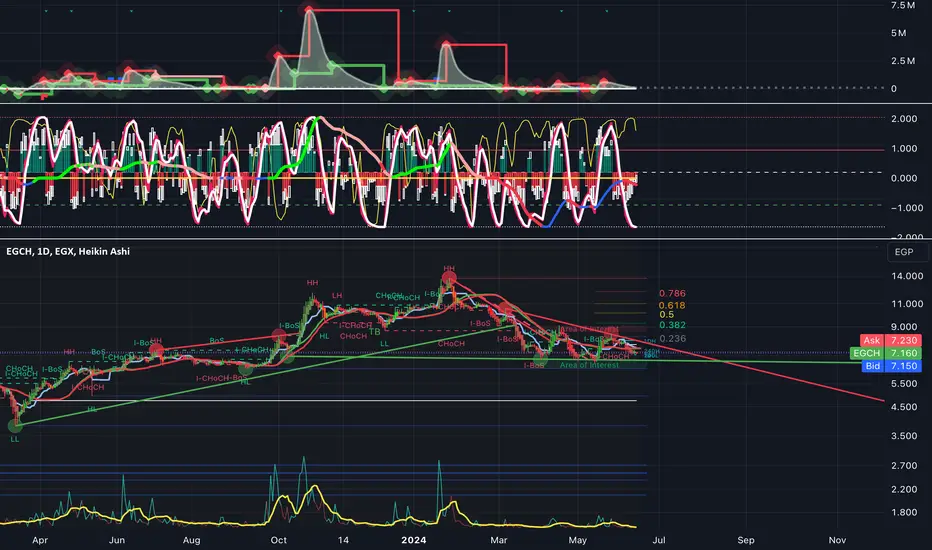
Comprehensive Technical Analysis and Outlook for KIMA StockThe KIMA stock chart presents a comprehensive technical analysis with several indicators and overlays. At the top, the Volume Price Trend (VPT) indicator highlights cumulative volume adjusted for price changes, reflecting significant buying and selling pressures through its peaks and troughs. The Ef
KIMA's performance remains mediocreKIMA's performance remains mediocre, struggling to gain traction at the 7.87 level. It's like Deportivo La Coruña during their relegation seasons. Despite having a talented player like Lucas Pérez, who showed great potential and skill, the team struggled significantly and faced relegation from La Li

Chicago Bulls Chart Play: EGAL's Bullish Setup Echoes 1999 ChampEGAL is in the golden zone, aiming for the 61% Fibonacci retracement, mirroring the EGX70EW. A bullish TK cross could emerge next week. The mid-point of the Bollinger Band rests at the 50% Fibonacci, with the upper band at the 61%. The 50% Fibonacci level is the current hurdle, and volume is diminis

EGCH, long uptrend to 11.3 , 15.5EGCH, Egypt
One the weekly chart, a technical pattern flag was formed, and the target is 11.3
Once we cross up this level, the stock should target 15.5
This is a medium term view in few months.
Profit protection should be considered.

EGCH 23/06/18 in Supply ZoneThis stock in the supply zone if it crossed 10 LE can target the historical high

KIMA EGX EGCH ready to flyPositive indications and signs. Very high probability for a nice upwards move. EGX stock EGCH.
Monthly chart is also very supportive for upwards trend.

See all ideas
Summarizing what the indicators are suggesting.
Oscillators
Neutral
SellBuy
Strong sellStrong buy
Strong sellSellNeutralBuyStrong buy
Oscillators
Neutral
SellBuy
Strong sellStrong buy
Strong sellSellNeutralBuyStrong buy
Summary
Neutral
SellBuy
Strong sellStrong buy
Strong sellSellNeutralBuyStrong buy
Summary
Neutral
SellBuy
Strong sellStrong buy
Strong sellSellNeutralBuyStrong buy
Summary
Neutral
SellBuy
Strong sellStrong buy
Strong sellSellNeutralBuyStrong buy
Moving Averages
Neutral
SellBuy
Strong sellStrong buy
Strong sellSellNeutralBuyStrong buy
Moving Averages
Neutral
SellBuy
Strong sellStrong buy
Strong sellSellNeutralBuyStrong buy
Displays a symbol's price movements over previous years to identify recurring trends.
Related stocks
Frequently Asked Questions
The current price of EGCH is 7.680 EGP — it has decreased by −3.03% in the past 24 hours. Watch EGYPTIAN CHEMICAL INDUSTRIES (KIMA) stock price performance more closely on the chart.
Depending on the exchange, the stock ticker may vary. For instance, on EGX exchange EGYPTIAN CHEMICAL INDUSTRIES (KIMA) stocks are traded under the ticker EGCH.
EGCH stock has fallen by −2.04% compared to the previous week, the month change is a −4.13% fall, over the last year EGYPTIAN CHEMICAL INDUSTRIES (KIMA) has showed a 7.71% increase.
EGCH reached its all-time high on Aug 16, 2011 with the price of 18.661 EGP, and its all-time low was 0.154 EGP and was reached on Mar 3, 2003. View more price dynamics on EGCH chart.
See other stocks reaching their highest and lowest prices.
See other stocks reaching their highest and lowest prices.
EGCH stock is 3.40% volatile and has beta coefficient of 0.81. Track EGYPTIAN CHEMICAL INDUSTRIES (KIMA) stock price on the chart and check out the list of the most volatile stocks — is EGYPTIAN CHEMICAL INDUSTRIES (KIMA) there?
Today EGYPTIAN CHEMICAL INDUSTRIES (KIMA) has the market capitalization of 15.71 B, it has decreased by −0.66% over the last week.
Yes, you can track EGYPTIAN CHEMICAL INDUSTRIES (KIMA) financials in yearly and quarterly reports right on TradingView.
EGYPTIAN CHEMICAL INDUSTRIES (KIMA) is going to release the next earnings report on Sep 3, 2025. Keep track of upcoming events with our Earnings Calendar.
No, EGCH doesn't pay any dividends to its shareholders. But don't worry, we've prepared a list of high-dividend stocks for you.
Like other stocks, EGCH shares are traded on stock exchanges, e.g. Nasdaq, Nyse, Euronext, and the easiest way to buy them is through an online stock broker. To do this, you need to open an account and follow a broker's procedures, then start trading. You can trade EGYPTIAN CHEMICAL INDUSTRIES (KIMA) stock right from TradingView charts — choose your broker and connect to your account.
Investing in stocks requires a comprehensive research: you should carefully study all the available data, e.g. company's financials, related news, and its technical analysis. So EGYPTIAN CHEMICAL INDUSTRIES (KIMA) technincal analysis shows the strong sell today, and its 1 week rating is sell. Since market conditions are prone to changes, it's worth looking a bit further into the future — according to the 1 month rating EGYPTIAN CHEMICAL INDUSTRIES (KIMA) stock shows the neutral signal. See more of EGYPTIAN CHEMICAL INDUSTRIES (KIMA) technicals for a more comprehensive analysis.
If you're still not sure, try looking for inspiration in our curated watchlists.
If you're still not sure, try looking for inspiration in our curated watchlists.