THE END OF ETHI think they’re about to trap all of you in the most popular alts.
Bitcoin. Ethereum. XRP. Solana. ADA. DOGE. PEPE. You name it.
The end of ETH is near.
🟩 Green = I’m buying
🟥 Red = I’m selling
Last time we predicted the drop from $4,000 to $1,400.
This time I want to see ETH under $1,000.
Good luck holding your bags when the market rug gets pulled.
I’m not here for likes — I’m here for entries. Stay sharp. 🧠📉
ETHUSD trade ideas

ARKK: The Calm Before the Innovation Storm -ALTSEASON Is COMING🚀 ARKK: The Calm Before the Innovation Storm 🌪️
The markets are shifting, and disruption is about to go vertical. ARK Innovation ETF (ARKK) is quietly positioning itself for what could be the most explosive move of this decade. With high-conviction bets in AI, Bitcoin, genomics, and next-gen tech, this isn’t just a fund—it’s a launchpad for exponential growth.
This post breaks down exactly why ARKK could go parabolic—and why the smart money is already moving in. 👇
Explosive upside in 2026
ARKK is already up over 24% YTD , showing strong momentum compared to broader markets and signaling early stages of a potential parabolic move .
High-conviction concentration in game-changers
Top 10 holdings include Tesla, Roku, Zoom, Coinbase, UiPath, Block, Crispr Therapeutics, DraftKings, Shopify, and Exact Sciences. These are leaders in innovation sectors with massive upside potential .
Deep exposure to Bitcoin and digital assets
Heavy allocation to Coinbase and Block gives indirect exposure to Bitcoin . If BTC breaks into a new cycle high , ARKK stands to benefit significantly.
Positioned in exponential growth sectors
Focus on AI, genomics, EVs, fintech, robotics, and blockchain , all of which are entering accelerating adoption phases globally.
Aggressive smart-money accumulation
Cathie Wood’s team continues buying aggressively during dips, reinforcing institutional confidence in the fund’s long-term trajectory.
Technical breakout structures forming
Ascending triangle and multi-month consolidation breakouts suggest a technical setup primed for explosive upside .
Innovation supercycle aligning
ARKK's themes are aligned with major global shifts like de-dollarization, decentralized finance, and AI convergence .
High beta = massive upside leverage
With a beta above 2 , ARKK tends to outperform in bull runs , offering leveraged exposure to innovation without the need for margin.
Resurgence of top holdings
Names like Coinbase, Tesla, Shopify, and Roku are up 50%–100% YTD , driving ARKK’s NAV growth and fueling bullish sentiment .
Long-term vision with short-term catalysts
The fund projects 5x returns over the next five years , while Bitcoin halving cycles, tech innovation, and regulatory clarity serve as short-term ignition points .
Marty Boots | 17-Year Trader — smash that 👍👍, hit LIKE & SUBSCRIBE, and share your views in the comments below so we can make better trades & grow together!

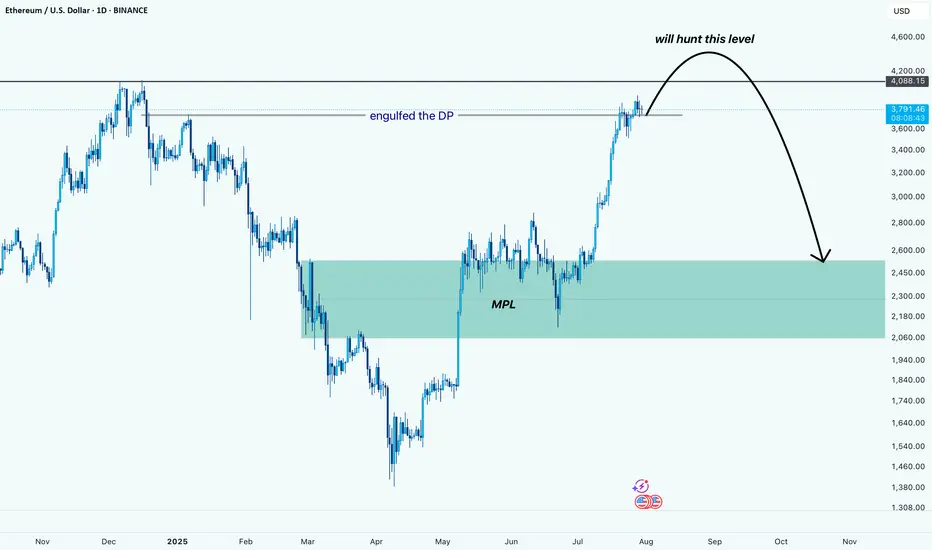
ETH (just a perspective): Potential Liquidity Grab Before DeeperPrice has engulfed the DP and is now pushing higher. Based on the current structure, it looks like ETH wants to hunt the liquidity resting above the $4,080 level.
After grabbing that liquidity, we might see a sharp reversal back down toward the MPL, which sits in the $2,100–$2,500 zone. This area is a strong demand zone and also where the most pain would be felt for late buyers, making it a key level to watch.
⚠️ This is not a prediction, just a perspective based on price behavior and structure.
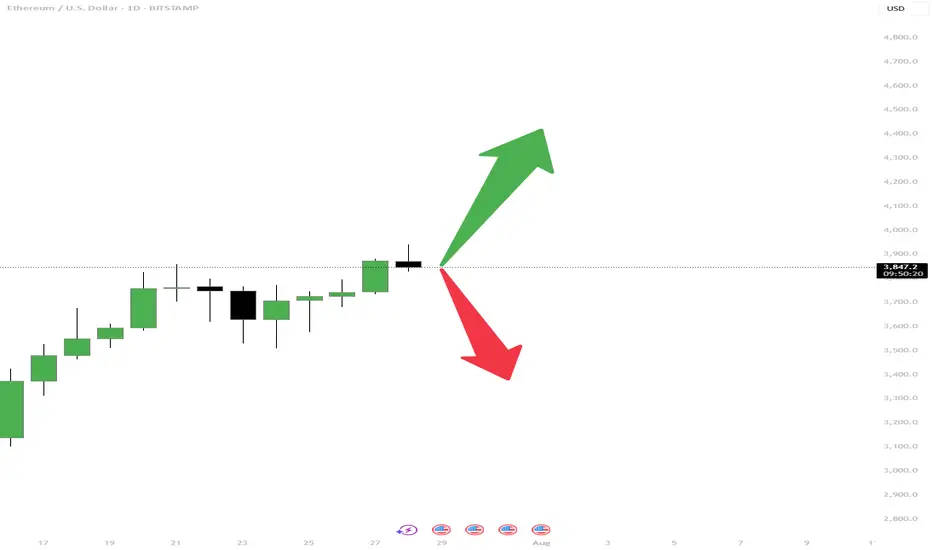
ETH is at a turning point — What would you do?Hey traders, how's everything going with you?!
The price has been increasing for days, but now it’s slowing down. From here, ETH can either:
🟢 Go higher and continue the uptrend
🔴 Or drop and start a pullback
This is a key moment. Some traders are preparing to buy the breakout, others are waiting to sell the drop, and some are watching for more clues.
👉 If this were your chart, would you do:
Buy?
Sell?
Wait?
Comment below and let’s learn from each other 👇. I would also appreciate it if you could hit the boost and follow!
Have a great day, everyone!
-Neo
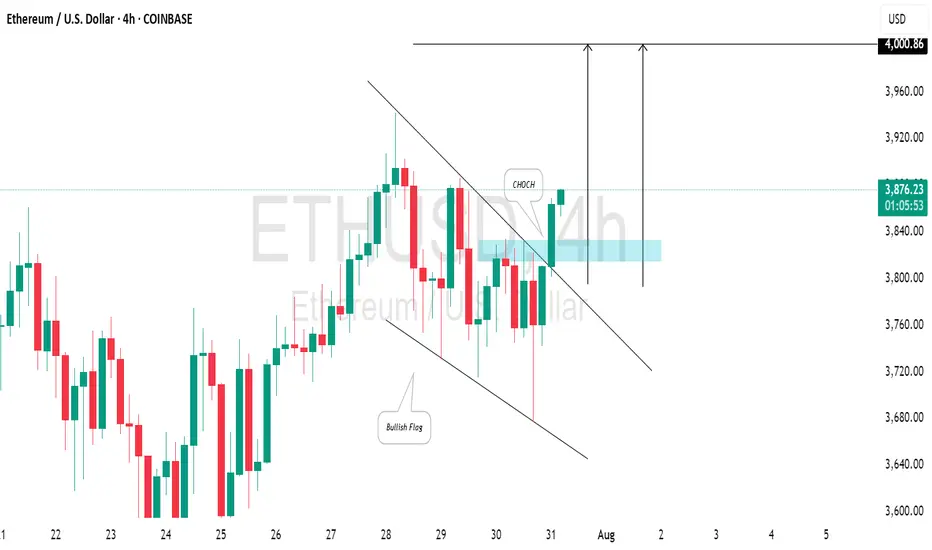
ETHEREUM (ETHUSD): Strong Bullish SignalsI spotted 2 important price action confirmations on 📈ETHEREUM:
The price has surpassed a resistance line of a bullish flag and established a confirmed change of character (CHoCH) on the 4-hour chart.
I believe the market will maintain a bullish trend, with the next resistance at the 4000 level.
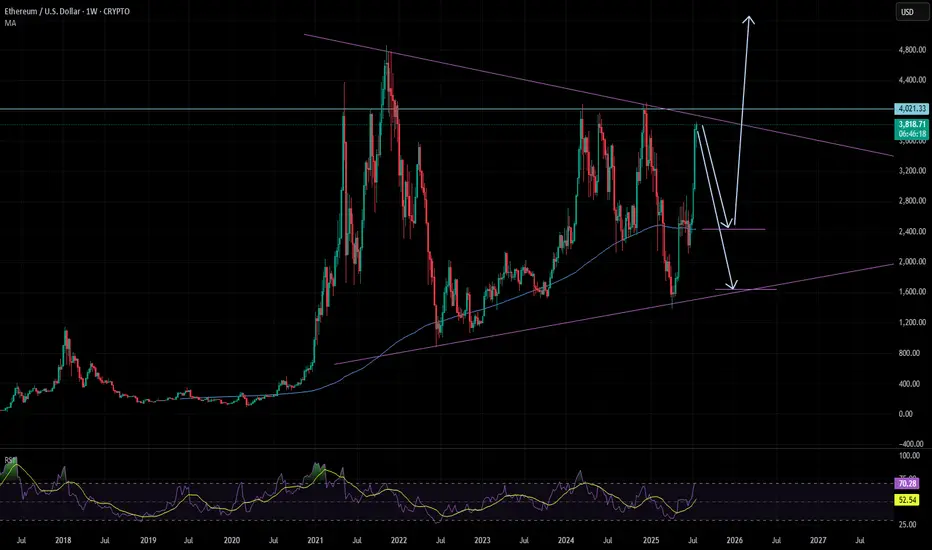
ETH is not going up soonETH made a beautiful bullrun from the trendline.
Now most people will be convinced we will break the 4K level and so straight up.
I'm not convinced, and that is because the last bullist candles are too extended. It's highly unlikely it will go straight up to + 4k from here.
Second we are in a massive triangle that has to play out first.
So what I believe will happen in the next months is that ETH will pullback to 2500 or even lower 1700. Allot of buyers that FOMO in now will be trapped and panic sell.
Then end on the year when QE has done and there is enough fuel to break out of the triangle. It will happen fast maybe arround nov / dec.
So don't fomo in wait
ETH/USD Long Setup Targeting $3,790ETH/USD 1H Trade Setup:
Price is currently at $3,748.5 with a long (buy) setup targeting $3,790.9. The stop loss is set at $3,725.4, aiming for a breakout to the upside within a tight consolidation range.

ETHUSD Will Go Down From Resistance! Sell!
Here is our detailed technical review for ETHUSD.
Time Frame: 1D
Current Trend: Bearish
Sentiment: Overbought (based on 7-period RSI)
Forecast: Bearish
The market is testing a major horizontal structure 3,641.87.
Taking into consideration the structure & trend analysis, I believe that the market will reach 2,871.15 level soon.
P.S
Overbought describes a period of time where there has been a significant and consistent upward move in price over a period of time without much pullback.
Disclosure: I am part of Trade Nation's Influencer program and receive a monthly fee for using their TradingView charts in my analysis.
Like and subscribe and comment my ideas if you enjoy them!

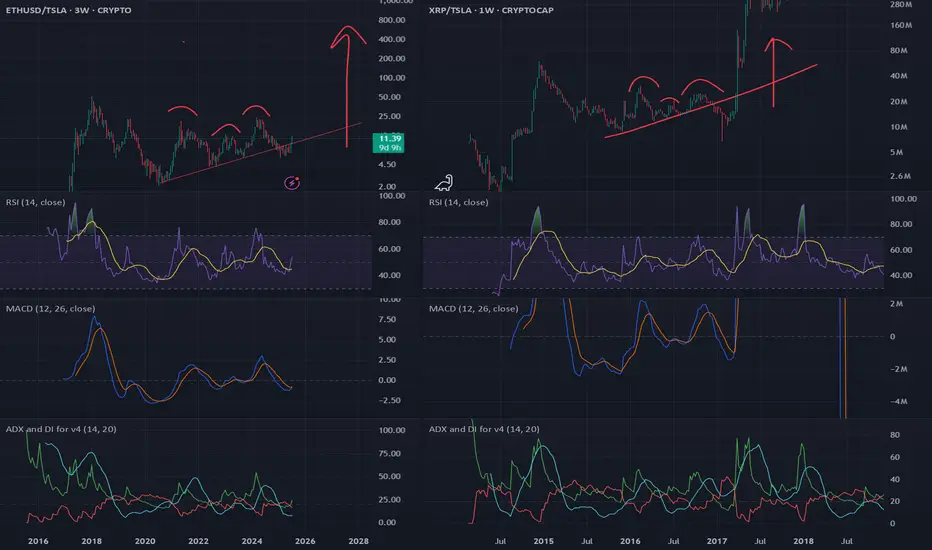
ETHEREUM Massive Triangle break-out ahead??Ethereum (ETHUSD) has been trading within a 4-year Triangle for the entirety of this Cycle. The recent post April rally has been the most aggressive since the parabolic rally that led to the Top of the previous Cycle.
The price is now almost on the top (Lower Highs trend-line) of the Triangle. A break above it, can initiate an aggressive Bullish Leg towards the 1.618 Fibonacci extension ($8000), which was the level that was marginally exceeded during ETH's first rally of this Cycle.
-------------------------------------------------------------------------------
** Please LIKE 👍, FOLLOW ✅, SHARE 🙌 and COMMENT ✍ if you enjoy this idea! Also share your ideas and charts in the comments section below! This is best way to keep it relevant, support us, keep the content here free and allow the idea to reach as many people as possible. **
-------------------------------------------------------------------------------
💸💸💸💸💸💸
👇 👇 👇 👇 👇 👇

ETH/USD – Macro Wave Map to $10,000? ETH/USD – Macro Wave Map to $10,000? 🚀🔥
Ethereum has broken out of its prolonged corrective structure, moving decisively above the equilibrium zone (~$3,500) and signaling the start of a potential macro impulsive wave (Elliott Wave 3 of 5).
Key Observations (Weekly Chart)
Wave Structure: The corrective (W)-(X)-(Y)-(Z) phase is complete, with ETH now forming the early stages of a wave (3) targeting $8,500–$9,000.
Equilibrium Flip: Price reclaimed the premium zone (~$3,500), indicating smart money accumulation.
Macro Target: If wave (3) plays out fully, wave (5) could extend toward $10,000+ by 2026.
Volume Spike: Sustained institutional demand confirms the bullish pivot.
Levels to Watch
Support (Re-entry Zone): $3,200 – $3,500 (previous resistance, now strong support) 🛡️
Primary Targets: $5,000 – $6,800 (wave 3 mid-range) 🎯
Extended Targets: $8,500 – $10,000 (wave 5 completion) 🏆
VolanX Macro Signal
Bias: Bullish as long as ETH stays above $3,200.
Risk Marker: A drop below $2,900 (200-week EMA) would invalidate this impulsive scenario.
Accumulation Strategy: DCA between $3,200 – $3,600 targeting $5,000+ in 2026.
VolanX View:
Ethereum’s current structure is primed for a multi-year expansion cycle, with smart money targeting untouched liquidity above $5K and potentially $10K. The roadmap remains bullish as long as we hold the reclaimed base zones.

ETH - BTC ETF News: What It Means for the Market+ China Rumors 🚨 ETH - BTC ETF News: What It Means for the Market + China Rumors 💥🌐
July just ended with a crypto bombshell 💣 — and the market is barely reacting.
Let’s break it down:
🧠 One part hard news.
🌀 One part geopolitical smoke.
🎯 All parts worth watching if you care about macro market shifts.
🏛️ SEC Approves Real BTC & ETH for ETF Flows (July 29)
Say goodbye to the cash-only ETF model.
The SEC now allows direct in-kind creation/redemption of Bitcoin and Ethereum in ETFs.
That means providers like BlackRock, Fidelity, VanEck can now use actual BTC/ETH, not just synthetic tracking.
✅ Bullish Impact:
💰 Real Spot Demand: ETF inflows = real crypto buying
🔄 Efficient Arbitrage: No middle step via cash = faster flows
🧱 TradFi + Crypto Merge: ETFs now settle with crypto — not just track it
🎯 Better Price Accuracy: Spot ETFs reflect true market value more cleanly
📉 The market reaction? Mild.
But don’t get it twisted — this is a structural reset, not a meme pump.
⚠️ But There’s a Bearish Angle:
🏦 Centralized Custody: Crypto now lives in Coinbase, Fireblocks vaults
⚠️ Network Risks: ETF performance now tied to ETH/BTC uptime
🧑⚖️ Regulatory Overreach: More hooks into validator networks, MEV relays
🌊 Volatility Risk: Panic redemptions = real BTC/ETH sold into open markets
Still, this is good news for Ethereum in particular.
Why? Because ETH isn’t just money — it’s infrastructure.
And now Wall Street is finally using it, not just watching it.
🇨🇳 And Then There’s China… Rumor or Tumor?
Crypto Twitter is swirling with unconfirmed whispers from July 29 that China may be prepping a major Bitcoin statement ahead of the BRICS summit.
But let’s be clear:
🚨 It’s a rumor. Or a tumor. 🧠
And like many tumors in crypto — there’s a 40% chance it brings bad news. 🤕
Still, here’s what’s being floated:
🧠 Speculations Include:
🔓 BTC re-legalization in “special finance zones” (HK-style)
🏦 BTC in national reserves (!)
🤖 CBDC integration or smart contract interoperability
⚒️ Return of official state-backed Bitcoin mining
🧯 But no official sources. Just geopolitics + timing.
China’s FUD/FOMO pattern is Bitcoin tradition — don’t get trapped by hopium.
But if even half of it is true... buckle up.
📈 Ethereum Leads the Charge — But Watch These Alts:
If ETFs go fully crypto-native, some sectors light up 🔥
🔹 1. Ethereum Layer 2s (ARB, OP, BASE)
→ ETF gas pressure = L2 scaling demand
🔹 2. DeFi Protocols (UNI, AAVE, LDO)
→ TradFi liquidity meets on-chain utility
🔹 3. ETH Staking Derivatives (LDO, RPL)
→ Institutions want yield = LSD narrative grows
🔹 4. Oracles (LINK)
→ ETFs need trusted on-chain data = Chainlink shines
🔹 5. BTC on ETH Bridges (ThorChain, tBTC)
→ If BTC flows into ETH-based ETFs, bridges light up
🚫 What I will Avoid:
❌ Memecoins – zero relevance to ETF flows
❌ GameFi – not part of TradFi’s roadmap
❌ Ghost Layer 1s – no users, no narrative, no pump
🧠 My Take:
ETH is building momentum toward $4,092 — the third breakout attempt on your 1-2-3 model.
🔥 The fuse is lit. Target? $6,036
Timing? Unknown. But structure is in place.
Meanwhile, Bitcoin Dominance is rising.
ETH is shining.
Solana — while powerful — continues paying the price for memecoin madness 💀
We’re entering a new phase — where ETFs settle with real crypto , China watches the stage, and macro money is warming up behind the curtain.
So stack smart.
Study the flows.
Don’t let silence fool you — the biggest moves come after the news fades.
One Love,
The FX PROFESSOR 💙
Disclosure: I am happy to be part of the Trade Nation's Influencer program and receive a monthly fee for using their TradingView charts in my analysis. Awesome broker, where the trader really comes first! 🌟🤝📈

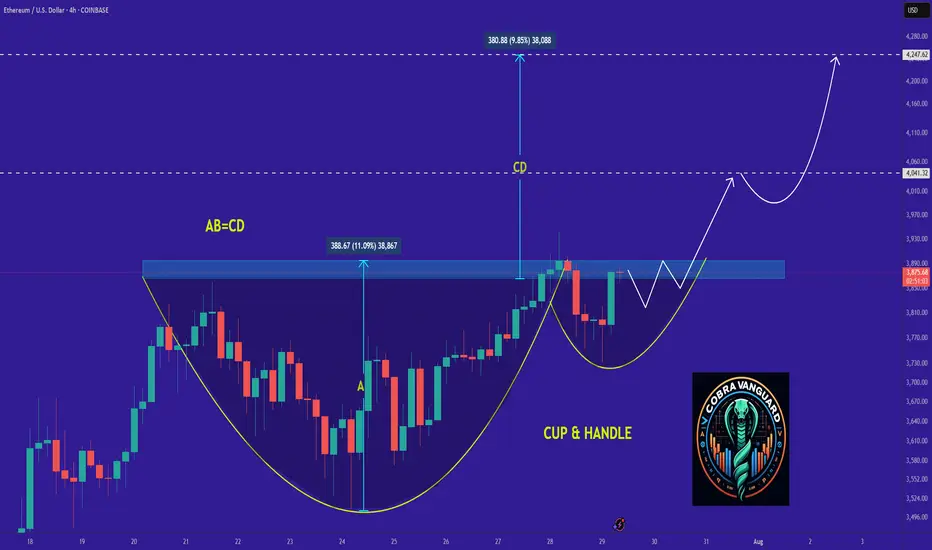
Ethereum - Time to buy again!It can be said that the price has formed a cup and handle pattern, which it is completing soon. If the price follows this pattern, it can be expected that Ethereum will reach its peak again.
Best regards CobraVanguard.💚
Strategy Idea: “React, Don’t Predict” ETH at Decision ZoneHey Traders, Ethereum recently made a strong move up to around $3,600. Now it’s slowing down, and we’re at a key decision point. Two things can happen from here:
Option 1 – Pullback:
If the price drops, watch the $3,200–$3,300 zone. That area could act as support. If a strong bullish candle forms there (on the daily or 4H chart), it could be a good buying opportunity.
Option 2 – Breakout:
If ETH stays above $3,550 and breaks the recent high with strong momentum, price could move toward $3,800 or even $4,000. Only buy if the breakout is clear and strong.
Basic Plan for New Traders:
Wait for confirmation before entering
Don’t buy the top
Use stop loss to manage risk
Only risk what you can afford to lose
Be patient. No setup = no trade
Reminder:
We don’t predict, we react. Let the chart show the move, then decide. Stay safe and stick to your plan.
Don't forget to follow me, boost this content, and comment if you like this strategy idea or have any questions.
-Neo
ETHEREUM: THE NEW BOND OF THE DIGITAL WORLDPrice isn’t the goal. Price is the side effect.
Meanwhile, BlackRock - a black hole with a trust-backed logo - just absorbed 42,000 ETH more.
Yesterday, you may have read this "regular" headline:
BlackRock increases its Ethereum exposure to $4 billion, adding $109.5 million via ETFs.
But here’s what you missed: there are no random numbers on the market.
When a player like this moves - it’s not hype. It’s a blueprint for the future.
Ethereum is no longer an altcoin.
It’s no longer speculation. It’s a financial infrastructure, already recognized by law, exchanges, and institutions.
What does this mean?
💡 Ethereum is now a digital bond - with yield flowing from blocks.
Profit is no longer built on promises, but on the structure of the chain itself.
Trust lies not in faces, but in code.
Growth is not artificial — it’s architectural.
And here’s why this is terrifyingly beautiful:
While you sleep, they are building an era.
Each ETF purchase removes ETH from circulation - permanently. Because:
✅ This ETH is gone from the open market
✅ It won’t be panic-sold
✅ It becomes income-bearing collateral, not a speculative asset
Still waiting for an entry signal?
The big players are already in.
This is no longer crypto - this is cash flow infrastructure, embedded into the digital economy.
And when pension funds, insurers, and sovereign investors move into Ethereum - they will come via ETFs.
Not because it’s trendy, but because it’s regulated, stable, and profitable.
📉 When institutional demand meets vanishing supply - the price won’t simply rise. It will explode, not as growth, but as a structural liquidity shift.
Ethereum is:
💸 Staking = passive yield
🔗 Backbone of DeFi
🖼 Fuel for NFTs
⚙️ Millions of transactions per second
⚖️ A regulated ETF asset
This is the new digital bond system, where the bet isn’t on the dollar - it’s on ETH as an income-producing asset.
💥 While you're reading this, the game is already on.
ETFs are rewriting the rules of time-ownership.
No hype. Just filings. Just intention.
Best regards EXCAVO

Why ETH Remains Bullish and Its Next Potential Move !It appears that the price is forming a cup and handle pattern, and if this occurs, it could push the price above $4K.
Best regards CobraVanguard.💚


Ethereum Weekly Recap & Gameplan | 27.07.2025📈 Market Context:
ETH followed the broader crypto market momentum led by Bitcoin, supported by institutional demand and positive macro policies in the U.S.
Last week’s plan played out cleanly — we saw strong gains from the 1H demand zone.
🧾 Weekly Recap:
• Price swept 4H swing liquidity and formed a 1H bullish BOS
• Created a solid 1H demand zone, from which price bounced strongly
• Momentum remained bullish as forecasted in last week’s post
📌 Technical Outlook:
→ Expecting a short retracement into 4H liquidity levels around 3761$ or 3702$
→ Then a continuation move towards ATH zone
🎯 Setup Trigger:
What I’m watching:
✅ Sweep of 4H liquidity
✅ Bullish BOS on 15M–30M
→ This will serve as the confirmation for long entries
📋 Trade Management:
• Stoploss: Below the confirmation swing low
• Target: 4100$
💬 If you found this helpful, don’t forget to like, comment, and follow — I share setups like this every week!

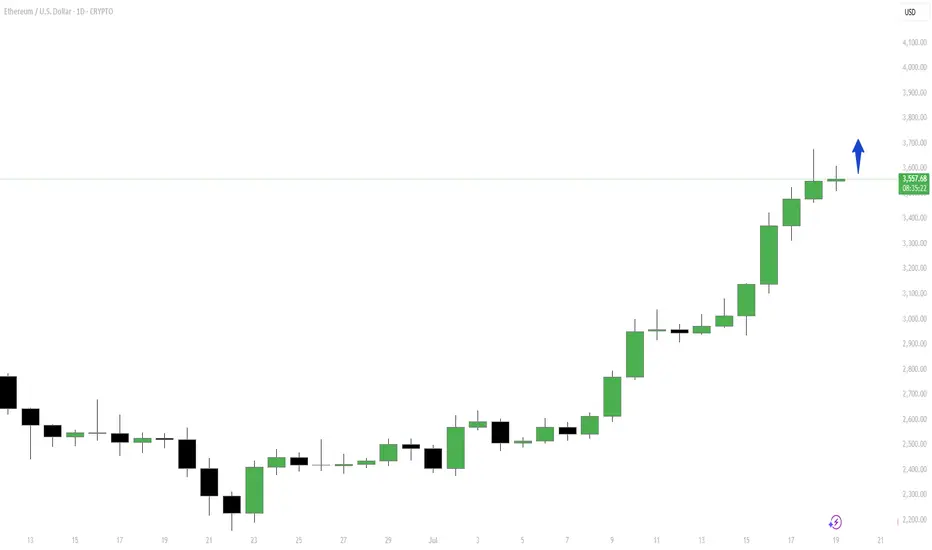
Will we finally test $3900?If this trend continues, we should be testing $3900 soon. It is also possible the magic lines I drew are making me see things. Let's see what happens, what do you guys think? $3900 today...or next month?
ETHUSD : Good luck :-)A lot of people get carried away easily.
It is ALWAYS a MISTAKE to buy at the TOP. You have already missed the boat.
Trade with common sense, not with emotion.
Good luck.

$Eth Bearish Divergence Alert – Correction Ahead?#ETHUSDT is approaching the $4000 zone, but momentum indicators signal caution 🧨
🔸 Bearish divergence spotted on RSI – price making higher highs, while RSI makes lower highs
🔸 MACD is showing signs of weakening bullish momentum
🔸 Stochastic RSI reflects fading buyer strength, hinting at possible seller dominance
If correction plays out, key support zones to watch are $3000 – $3200 👀
That range may offer a bounce opportunity, but if broken, deeper downside is possible ⚠️
Trade wisely and always manage risk 🎯
#Ethereum #CryptoAnalysis #BearishDivergence #CryptoSignals

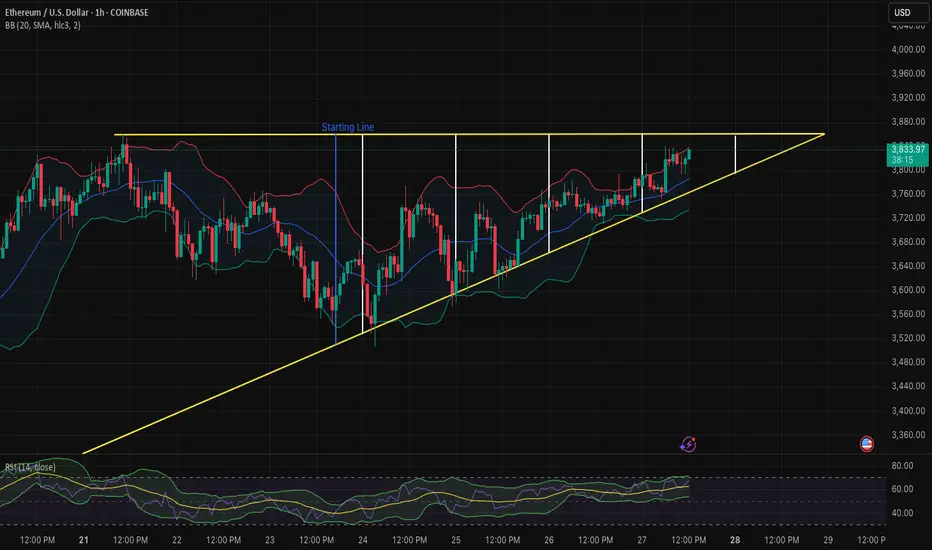
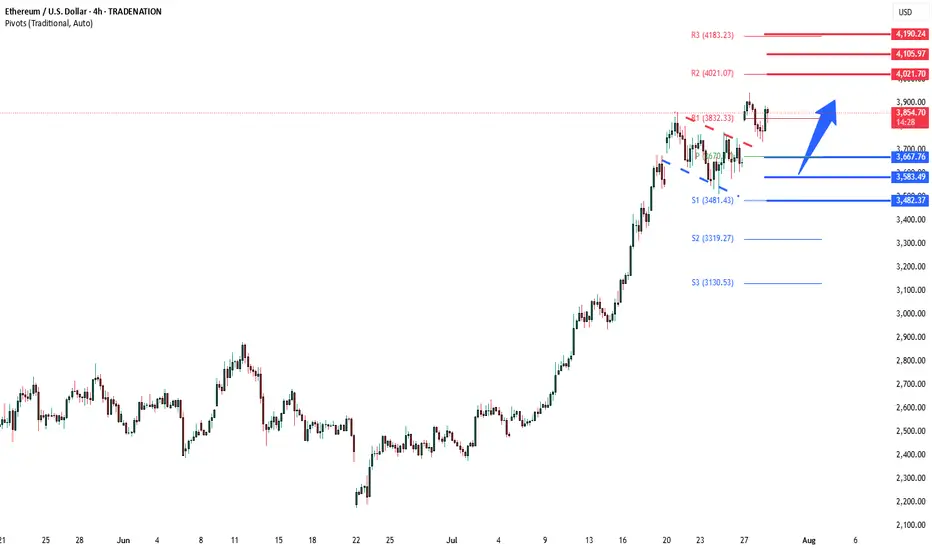
ETHUSD Bullish Flag breakout support at 3,667The ETHSD remains in a bullish trend, with recent price action showing signs of a corrective pullback within the broader uptrend.
Support Zone: 3,667 – a key level from previous consolidation. Price is currently testing or approaching this level.
A bullish rebound from 3,667 would confirm ongoing upside momentum, with potential targets at:
4,020 – initial resistance
4,105 – psychological and structural level
4,190 – extended resistance on the longer-term chart
Bearish Scenario:
A confirmed break and daily close below 3,667 would weaken the bullish outlook and suggest deeper downside risk toward:
3,584 – minor support
3,482 – stronger support and potential demand zone
Outlook:
Bullish bias remains intact while the ETHUSD holds above 3,667. A sustained break below this level could shift momentum to the downside in the short term.
This communication is for informational purposes only and should not be viewed as any form of recommendation as to a particular course of action or as investment advice. It is not intended as an offer or solicitation for the purchase or sale of any financial instrument or as an official confirmation of any transaction. Opinions, estimates and assumptions expressed herein are made as of the date of this communication and are subject to change without notice. This communication has been prepared based upon information, including market prices, data and other information, believed to be reliable; however, Trade Nation does not warrant its completeness or accuracy. All market prices and market data contained in or attached to this communication are indicative and subject to change without notice.
Bullish Projection • Target Area: ~$4,080 – $4,100
• Current Price: ~$3,761
• Pattern Basis: Falling wedge breakout with expected move toward the target range.
• Risk Area: Highlighted in red below current price zone (~$3,700) indicating a stop-loss zone.
