ETH: Still optimistic and in transformationETH: Still optimistic and in transformation
Previously, ETH showed a strong bullish trend, but recent economic events have shaken things up.
On Friday, U.S. President Donald Trump announced a 50% tariff on the European Union, set to begin on June 1, 2025. This caused uncertainty in financial markets, triggering selling pressure on ETH, which dropped to $2,463—a key support level.
However, over the weekend, Trump extended the EU negotiations deadline until July 9, for talks between Washington and the 27-nation bloc to produce a deal.
If ETH holds the $2,463 support level, we could see another upward push in price.
You may find more details in the chart!
Thank you and Good Luck!
❤️PS: Please support with a like or comment if you find this analysis useful for your trading day❤️
ETHUSDT trade ideas

Ethereum $800m of Open interest rise - big move will happens soEthereum $800m of Open interest rise - big move will happens so soon
in a case of trpa price could take SL of those people
ETH Staying Bullish – Break Above Could Target $3K+$ETH/USDT Update
ETH is moving strong, forming clear higher highs and higher lows. Right now, it’s ranging in an accumulation zone just below key resistance.
As long as it holds above the 50 EMA and recent low, the trend looks bullish. A breakout here could send it flying toward $3,000+.
Still healthy, still in play.
DYOR, NFA

The Invisible Hand in Crypto: Are We Just Puppets?You think you’re trading based on your analysis?
Maybe you’re just thinking that.
The crypto market might be far more controlled than you realize — here’s how, when, and why .
Hello✌
Spend 3 minutes ⏰ reading this educational material.
🎯 Analytical Insight on Ethereum:
Following its impressive recent rally, ETH continues to show strength, supported by high volume and a clear bullish market structure. A key daily support—confluent with the Fibonacci zone and an ascending trendline—remains intact. My main target stands at the psychological $3,000 level, implying ~16% upside potential if momentum sustains. 🔍
Now , let's dive into the educational section,
📊 TradingView Tools: Decoding the Minds of the Whales
In a market where price moves often feel pre-scripted, precision tools aren’t a luxury — they’re survival gear. TradingView offers indicators like Accumulation/Distribution, On-Balance Volume, Smart Money Concepts, and Liquidity Heatmaps that help you spot where big money is entering or exiting . These tools, especially on higher timeframes, can reveal underlying accumulation or distribution before major moves happen. For instance, if OBV rises while price remains flat, whales might be silently building positions. Also, indicators like Whale Alerts, based on on-chain analysis, can show large transactions often tied to upcoming volatility. Combine this with tools like Volume Profile or classic trendlines, and you’re no longer chasing price — you’re anticipating it.
🎯 Collective Behavior or Whale-Orchestrated Moves?
Markets — especially crypto — haven’t moved on simple supply and demand for a long time. Many of the price spikes or dumps you see aren’t organic; they’re orchestrated. Big players with massive volumes steer liquidity to where they want it.
🧠 Retail Psychology: A Weapon in Bigger Hands
Why do you always enter after a pump? Why does the market bounce right after you panic sell? These are not coincidences. Fear and greed are weapons. Smart money knows exactly how to trigger emotional trades from retailers, turning those reactions into their profits.
🔄 The Recycled Trap Scenarios
Here’s a classic: sudden green candle to trigger FOMO, followed by a slight dip, more retail buys in, then a sharp dump — liquidity collected. If this sounds familiar, it’s because it keeps happening. Those who spot it early survive.
📉 It’s About Liquidity, Not Your Support Line
Whales don’t care about your trendlines. They care about liquidity. If you know where most long or short positions are placed, you can often predict the next market move. TradingView indicators help identify liquidation zones — follow them.
🕹 You’re Just a Pawn — Unless You Learn the Map
If you’re just reacting candle by candle, you’re losing. But when you start thinking like whales, understanding their setups, you flip from pawn to player. Sentiment tools, volume flow, and behavioral indicators are your way out of the trap.
📌 Final Words
If you thought your analysis was behind your trades — think again. Smart money plays by a plan, and TradingView’s tools help you see the blueprint. Don’t be manipulated — learn to move like the movers.
always conduct your own research before making investment decisions. That being said, please take note of the disclaimer section at the bottom of each post for further details 📜✅.
Give me some energy !!
✨We invest countless hours researching opportunities and crafting valuable ideas. Your support means the world to us! If you have any questions, feel free to drop them in the comment box.
Cheers, Mad Whale. 🐋

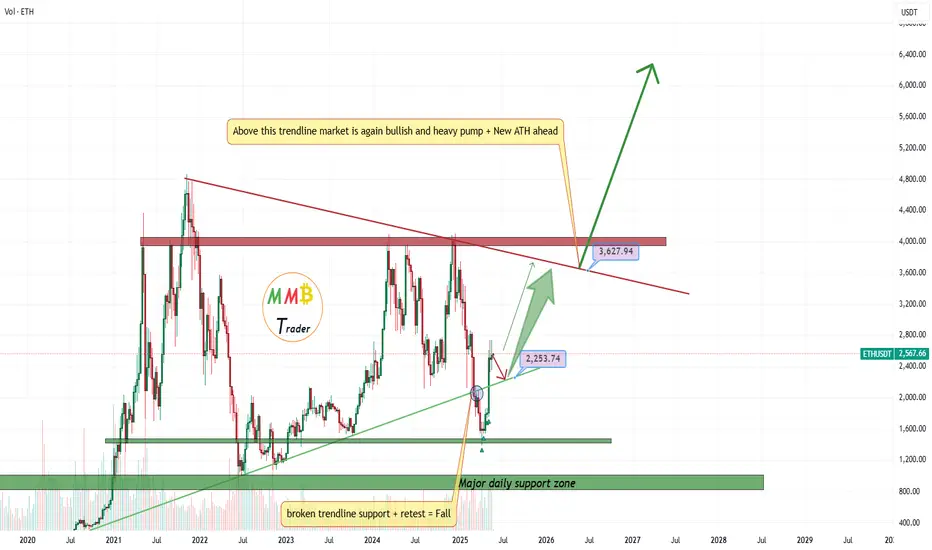
ETH Continues Bullish Momentum Above Broken TrendlineHello guys!
Ethereum has shown a strong bullish rally, breaking through a long-standing descending trendline with significant momentum. Currently, price action is consolidating above the broken trendline, which may now act as a support zone.
🔹 Scenario 1 (Bullish Continuation): If ETH holds above the current range and confirms the broken trendline as support, we could see a continuation toward higher resistance levels around $3,500 and beyond.
🔹 Scenario 2 (Deeper Retest): Alternatively, a pullback toward the $2,200–$2,300 area (highlighted zone) could offer a better accumulation point before the next bullish leg resumes.
This setup suggests that as long as ETH remains above the key support levels, the bullish structure remains intact.

ETH/USDT Potential UpsidesHey Traders. in today's trading session we are monitoring ETH/USDT for a buying opportunity around 2420 zone, Ethereum is trading in an uptrend and currently is in a correction phase in which it is approaching the trend at 2420 support and resistance area.
Trade safe, Joe.

Short term next target for ETH - 1100$; Market crash in JuneEthereum will be reaching 2808$ in coming days before month May is closed.
ETH almost reached main liquidity zone for this rally and also 200MA. As soon this level is done - expect another market crash in June.
Next crash will be super fast and most of altcoins will drop even lower.
Target for ETH in month of June is between 1100$ and 1300$.
After this crash we will see altcoin season and ETH will lead it.
We are entering last phase of a bull run. There are about 3 months left before we enter a bear market officially.
Here is previous idea from 1300$ to 2808$

Ethereum Is Nearing an Important SupportHey Traders, in today's trading session we are monitoring ETH/USDT for a buying opportunity around 2,435 zone, Ethereum is trading in an uptrend and currently is in a correction phase in which it is approaching the trend at 2,435 support and resistance area.
Trade safe, Joe.

Ethereum Eyes New Highs as BTC Breaks Records🚀 Ethereum Eyes New Highs as BTC Breaks Records
Ethereum has broken out of a bullish flag pattern and seems ready to rise further.
Yesterday, Bitcoin surged to $111,800, hitting a new all-time high and fueling hopes for further gains.
If BTC keeps pushing upward, Ethereum is likely to follow.
The price could first test $2,600 before continuing its rally.
🎯 Next targets:
$2,800
$2,915
$3,000
You may find more details in the chart!
Thank you and Good Luck!
❤️PS: Please support with a like or comment if you find this analysis useful for your trading day❤️

ETH - BBB - Bullish Building Block!Hello TradingView Family / Fellow Traders. This is Richard, also known as theSignalyst.
🏢 ETH Building Blocks:
📈 Short-Term Bullish:
ETH is currently bullish trading within the second floor in the shape of a rising channel marked in green.
As ETH retests the lower green trendline and $2,550 structure, we’ll be looking for short-term trend-following long setups!
📈 Long-Term Bullish:
For the bulls to remain in control medium-term and push towards the $3,000 mark, a break above the last major high at $2,750 is needed.
📉 Short-Term Bearish:
If the $2,550 structure is broken downward, ETH's momentum will be shifted from bullish to bearish leading to a correction phase towards the $2,300 support.
📚 Always follow your trading plan regarding entry, risk management, and trade management.
Good luck!
All Strategies Are Good; If Managed Properly!
~Rich

ETHUSDT: Possible Minor to Major Corrections May HappenETHUSDT has a higher chance of experiencing a minor or major correction in the coming days, although we haven’t confirmed this yet. We need more confirmation before we can be certain about the future of ETH. However, if the price decides to undergo a major correction, it’s likely to drop to our second area, where it’s expected to fill the liquidity gap and then reverse, continuing towards our three targets.
Please use this analysis as secondary bias only or even only for educational purposes. Always conduct your own analysis and risk management before trading or investing in cryptocurrencies, as they carry significant financial risk. Good luck and trade safely.
If you want to support us, you can do so by liking the idea, commenting with your views, or sharing it.
Much love ❤️
Have a great weekend
Team Setupsfx_

ETHUSDT still sleep but soon will break the NewsETHUSDT this time will touch new ATH with Bitcoin pump not like previous time sleep price is still weak but first resistance is broken and soon will pump above 3000$ and the journey will start there and huge pump will lead ASAP.
DISCLAIMER: ((trade based on your own decision))
<<press like👍 if you enjoy💚
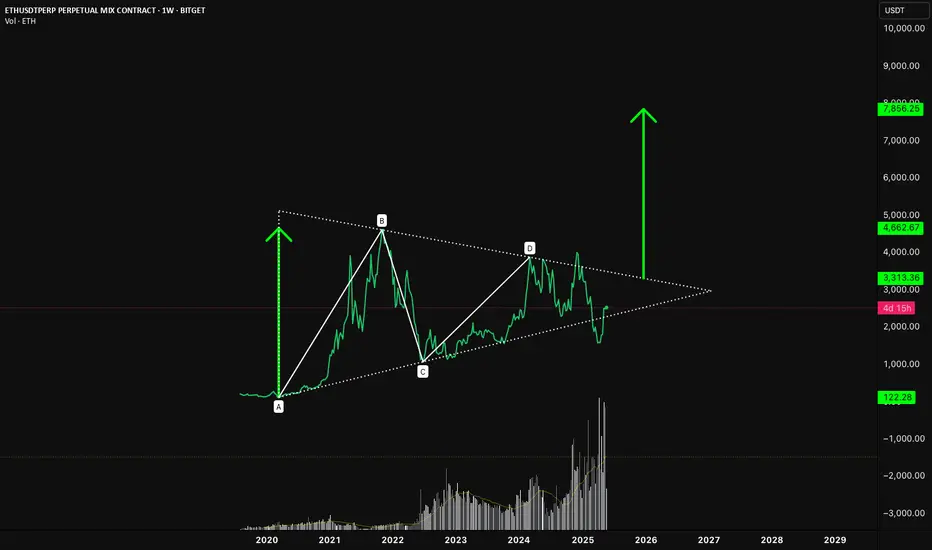
ETH/USDT – The Ethmuda TriangleZoom out.
Since the 2021 highs, Ethereum has spent years grinding sideways, printing what now looks like a textbook symmetrical triangle. Labeled here as an ABCD compression pattern, this structure has been tightening since the macro top (B), slowly building energy within narrowing volatility.
🔺 Structure Breakdown:
• A to B: The explosive bull run from the March 2020 low to the all-time high.
• B to C: A deep correction that shook out weak hands and set the bottom.
• C to D: A multi-year coil of consolidation, forming higher lows and lower highs.
• D to ?: We’re now nearing the apex, where compression typically leads to expansion.
📍 The Trigger Zone
The key level to watch is $4,000–$4,200. A clean breakout above this zone would invalidate the downtrend line and break the triangle to the upside. From a pattern-measured move perspective, the height of the triangle (A to B) projected from the breakout point suggests potential upside into the $7,800–$8,000 region.
🧠 Why This Matters
• Volume has been tapering throughout the structure — classic behaviour in large triangles.
• Market sentiment remains uncertain, making a breakout all the more impactful.
• Ethereum fundamentals are arguably stronger than they were in 2021 — Layer 2s, institutional use cases, and new ETH ETF speculation all add fuel.
📊 Potential Target:
• Immediate resistance: $3,300
• Breakout trigger: $4,000–$4,200
• Projected move: ~$8,000
🕰️ When? Well.. who knows but it does sort of line-up with my previous idea using a SOL/USDT chart that says early next year.. and not this year.
This is the type of setup plays out pretty well on lower timeframes, why not a massive one? The real question is: Are we on the verge of expansion after compression?
Let the chart do the talking.
⚡️ Not Financial Advice
Ethereum Urgent! $1B of Opene interest entered!!Ethereum Urgent! $1B of Opene interest entered!!
ofthen price make BIG move from it
1st key zone for long 2632
2nd key zone 2346

See if it can find support near 2521.05 and go up
Hello, traders.
If you "Follow" me, you can always get the latest information quickly.
Have a nice day today.
-------------------------------------
(ETHUSDT 1D chart)
The two charts above are charts that use the HA-MS indicator to mark support and resistance points on the 1M, 1W, and 1D charts.
The chart below is just a chart with the HA-MS indicator hidden.
If you look closely at the drawn support and resistance points, you can see that the points drawn with the HA-Low and HA-High indicators are important support and resistance points.
The HA-Low indicator is marked in orange (#ff9800), and the HA-High indicator is marked in blue (#0000ff).
It is impossible to explain all the thoughts of a chart analyst in writing.
That is why it is necessary to provide objective information to the readers.
Then, it will be very helpful for you to look at the chart.
If you think that my idea has too many indicators, you can disable the indicators by clicking "Grab this chart" in the idea article.
If you look at the chart with the indicators disabled, you may think that something looks better, but since you don't know why these support and resistance points were drawn, you may not be able to properly utilize the support and resistance points drawn on the chart when actually trading.
Even the support and resistance points you drew yourself often become unreliable due to the movement of the chart over time, and you will be even less reliable when it comes to support and resistance points drawn by others.
In order to reduce this phenomenon, objective information is necessary.
For that objective information, I use the HA-MS indicator.
For the trend perspective, there is the M-Signal indicator, and for the trading perspective, there are the HA-Low and HA-High indicators.
To understand the detailed movement, we use the DOM(60), DOM(-60), StochRSI 50, StochRSI 80, and StochRSI 20 indicators.
Therefore, you can basically interpret the chart by activating only the HA-Low, HA-High, and M-Signal indicators.
-
Therefore, if we interpret the chart, if it rises from the current price position, the resistance zone is around 3265.0-3321.30, and if it falls, the support zone is around 1647.06-1861.57.
You can see that the HA-High indicator is newly created at the current price position, and the M-Signal indicator on the 1M, 1W, and 1D charts is passing, so we can see that it is at an important turning point.
Therefore, the key question is whether the price can be maintained above 2609.74 or whether it will fall below 2359.35.
However, since the HA-High indicator is newly created, it is more likely to fall.
Since the OBV indicator showed that the OBV fell below the High Line, we need to check whether it can touch the OBV EMA again and rise above the High Line.
If the StochRSI indicator falls below 50, we need to focus on finding a time to buy, and if it rises above 50, we need to focus on finding a time to sell.
Since the OBV is currently on an upward trend, if this trend continues, the price is expected to eventually rise.
-
Thank you for reading to the end.
I hope you have a successful transaction.
--------------------------------------------------
- This is an explanation of the big picture.
(3-year bull market, 1-year bear market pattern)
I will explain more details when the bear market starts.
------------------------------------------------------

ETHUSDT - UniverseMetta - Signal #ETHUSDT - UniverseMetta - Signal
H4 - Formation of a 3-wave structure in continuation of the upward trend + exit from the channel. Stop behind the minimum of the 2nd wave.
Entry: 2589.93
TP: 2823.31 - 2992.67 - 3147.16 - 3408.07
Stop: 2437.44

ETH-bias long once retracesEth is possibly retracing to the fib 0.618 which is at 2121 before it will make new highs. Hence there is a strong support zone at the level.
bullish indications:
Trend line resistance is broken.
HHHL.
Bearish indications:
Bearish divergence .
Forming double top formation as the retracement.
Resistance is respected at 2731

ETH/USDT – Rejection from Equilibrium Zone After BOS, Bullish I'm watching a bullish setup on ETH/USDT (15-minute chart) based on Smart Money Concepts.
After a confirmed Change of Character (ChoCH) and a Break of Structure (BOS) to the upside, price retraced into the equilibrium zone and tapped a key support level near 2500 USDT — a psychologically and technically significant level. This area also aligns with the 50%-61.8% Fibonacci retracement and sits just below a bullish Order Block.
I’m positioning a Buy Limit at 2500 USDT, anticipating a continuation move back toward recent highs.
Entry: 2500 USDT
Stop Loss: 2,480 USDT (below previous low)
Take Profit: 2,534 USDT (recent swing high)
Risk: 20 USDT
Reward: 34 USDT
Risk:Reward Ratio ≈ 1:1.7
The wick into the zone suggests a liquidity sweep and potential bullish reversal. A strong bullish candle or a new BOS would confirm the continuation bias.

ETHUSDT IDEAThings still looks inside a consolidation phase and some breaks upside or downside is needed for long momentum trades.


$Eth Direction I think Eth will be waving some sort of correction t0 2240 - 2180 area then we should run while btc in this time is doing very good and expecting 125 k soon

Ethereum Late 2025 Targets Simplified —$7,331 & $11,318We are getting closer and closer to the bull run phase. We are getting closer to a period where the entire Cryptocurrency market will be extremely bullish. I wanted to simplified Ethereum's targets for you.
Having a long-term perspective can make your trading, your holding, much easier.
Imagine Ethereum goes to $4,500 and starts a strong retrace. As prices move up, you wouldn't feel compelled to sell, you would just be happy looking at the numbers on the screen and waiting for more. As soon as the correction comes, doubt can start to creep in. Should I sell now? Will it continue lower? Is this the end? How far down can it go?
We can plan ahead but the market impulse, the energy, the mass, the group, the herd, the news; things can shake us out of our hands, knowing in advance how high prices can really go, can make it easier for us to hold strong.
If Ethereum trades at $5,000 and stats to retrace, and you know that a minimum target of $7,300 is expected, then you can easily hold. But without this information it would be hard to do so when prices are down 30% from the top. The worst part is that we tend not to sell at the top, ignore the top and the impulse becomes really strong to sell when prices are low.
Ok. That's not the situation now. We bought early, we caught the bottom and it is the start of the bullish wave. Having 20 different targets can be as hard as having no targets, how much to sell and when?
So here are the targets simplified, these are the main targets for Ethereum in this upcoming bullish phase.
1) $3,345 ($3333). Easy target. Can be easily ignored. Resistance can change and instead of $3,345 it shows up at $4,015. Nobody cares, we are aiming higher.
2) The ATH. Ignore it will be broken.
3) $7,331. Now this will be a strong target and can even be the top, so this is one to watch out for. If the market reacts strong and there is huge bear volume, securing some profits wouldn't be a bad idea at this point, but there is more.
4) $11,318. This is full blown-bull market with major bullish force in place. If we get a great bull market, we can hit this target or even higher.
What I mean is that there is no point in selling at $3k, $4k or $5k. When the market shakes, ignore. When there is a retrace or correction, feel free buy-in, rebuy and reload.
Namaste.

ETH >>> Inverse Head & Shoulders Breakout Sets Stage for RallyHello guys!
Ethereum has formed a textbook inverse head and shoulders pattern on the 15-minute timeframe and just confirmed a breakout above the neckline. This bullish reversal formation comes after a sharp downtrend, signaling a potential shift in short-term momentum.
📌 Breakout Level: ~$2,645
🎯 Potential Target: ~$2,730–$2,750 based on the pattern height
🟦 Retest Zone: ~$2,620–$2,640
We’re currently seeing a healthy breakout followed by a possible retest of the neckline, which could offer a solid entry for continuation toward the upper boundary of the channel.
If bulls hold this structure, ETH could accelerate higher in the coming sessions.
