$QCOM | Long SemisIve been looking through semis for trades because they are showing relative strength compared to other sectors. NASDAQ:QCOM is one of my favorites at the moment alongside $MU. I expect this trade to take a while to play out--maybe 6 months or so.
Key facts today
Next report date
—
Report period
—
EPS estimate
—
Revenue estimate
—
9.18 EUR
9.11 B EUR
34.99 B EUR
1.10 B
About QUALCOMM Incorporated
Sector
Industry
CEO
Cristiano R. Amon
Website
Headquarters
San Diego
Founded
1985
FIGI
BBG000QFV8J5
QUALCOMM, Inc. engages in developing and commercializing foundational technologies and products used in mobile devices and other wireless products. It operates through the following segments: Qualcomm CDMA Technologies (QCT), Qualcomm Technology Licensing (QTL), and Qualcomm Strategic Initiatives (QSI). The QCT segment develops and supplies integrated circuits and system software based on technologies for use in voice and data communications, networking, application processing, multimedia, and global positioning system products. The QTL segment grants licenses and provides rights to use portions of the firm's intellectual property portfolio. The QSI segment focuses on opening new or expanding opportunities for its technologies and supporting the design and introduction of new products and services for voice and data communications. The company was founded by Franklin P. Antonio, Adelia A. Coffman, Andrew Cohen, Klein Gilhousen, Irwin Mark Jacobs, Andrew J. Viterbi, and Harvey P. White in July 1985 and is headquartered in San Diego, CA.


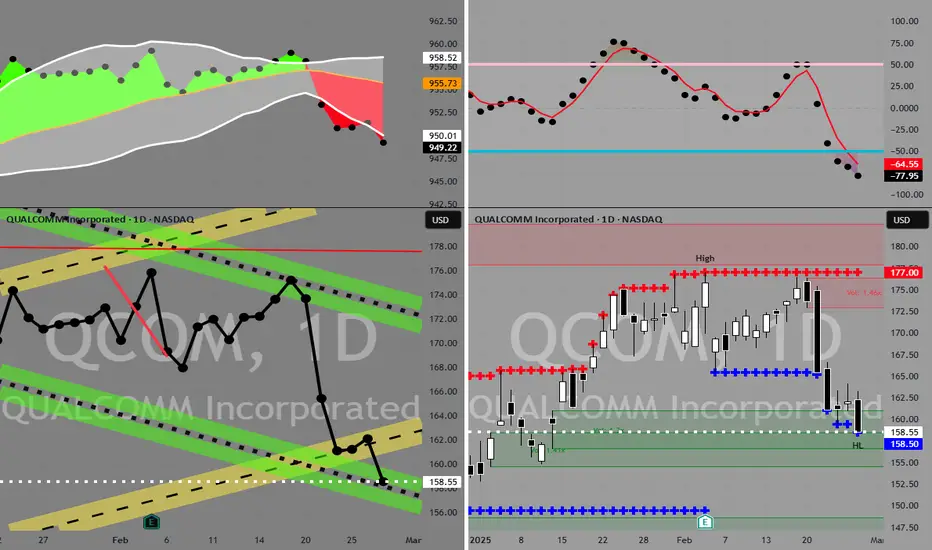
QCOM: Identifying Key Levels for a Potential Bullish ReversalOverview:
The chart for QCOM displays significant price action over the past year-plus, marked by a strong uptrend followed by a substantial correction/consolidation phase. Your drawings highlight critical demand and supply zones, and a potential bullish trade setup.
Historical Price Action (Light B


Quick View: $QCOM(daily) Consolidation with Bullish Crossover
(weekly), still bearish.
This is a very early signal
Watching $155 as key resistance.
Support → $133

QCOMan upward trend in the prices of an industry's stocks or the overall rise in broad market indices, characterized by high investor confidence
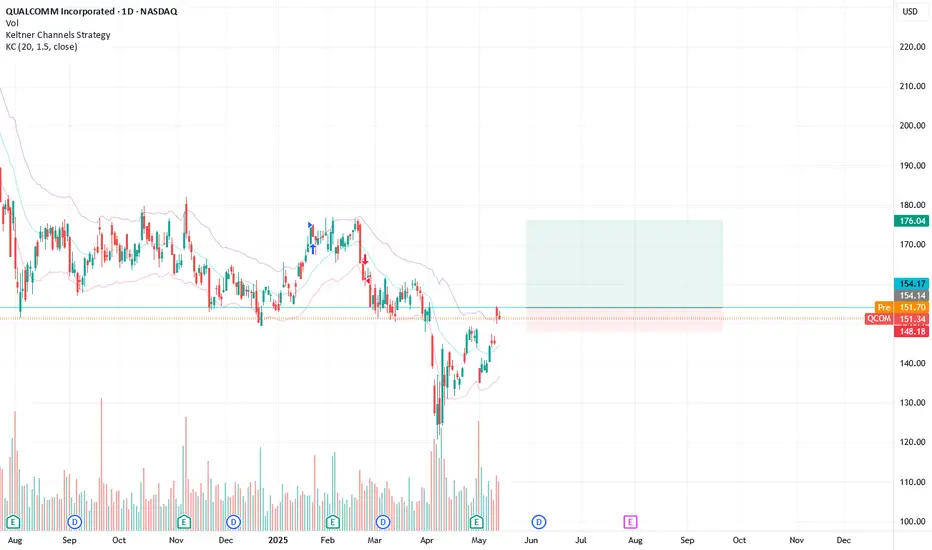
Qualcomm Remains BullishLike the market as a whole, Qualcomm shares recovered significantly. With the downward movement on May 1, which many market participants interpreted as a continuation of the bearish trend, the share delivered a precise 50% correction. This should not be seen as bearish, but rather gives hope for fur

QCOM Q1 EARNINGSQCOM is currently between two strong resistance levels above, and has solid support around the 120 level. If earnings are strong and he beats expectations, it's very likely the price will retest the upper range. If earnings miss, it would likely drop down to the double bottom.

QCOM in Buy ZoneMy trading plan is very simple.
I buy or sell when at three of these events happen:
* Price tags the top or bottom of parallel channel zones
* Money flow spikes beyond it's Bollinger Bands
* Stochastic Momentum Index (SMI) at near oversold overbought level
* Price at Fibonacci levels
So...
Here's
QCOM eyes on $158.81: Key Resistance to break and resume UpTrendChips have been suffering under the uncertainty of Trump.
QCOM had some good news that might help it paint a bottom.
$ 158.29-158.81 is key resistance for bulls to flip into support.
======================================================
.

See all ideas
Summarizing what the indicators are suggesting.
Neutral
SellBuy
Strong sellStrong buy
Strong sellSellNeutralBuyStrong buy
Neutral
SellBuy
Strong sellStrong buy
Strong sellSellNeutralBuyStrong buy
Neutral
SellBuy
Strong sellStrong buy
Strong sellSellNeutralBuyStrong buy
An aggregate view of professional's ratings.
Neutral
SellBuy
Strong sellStrong buy
Strong sellSellNeutralBuyStrong buy
Neutral
SellBuy
Strong sellStrong buy
Strong sellSellNeutralBuyStrong buy
Neutral
SellBuy
Strong sellStrong buy
Strong sellSellNeutralBuyStrong buy
Displays a symbol's price movements over previous years to identify recurring trends.
QCOM4984947
Qualcomm Incorporated 3.25% 20-MAY-2050Yield to maturity
6.67%
Maturity date
May 20, 2050
QCOM4499061
Qualcomm Incorporated 4.3% 20-MAY-2047Yield to maturity
6.19%
Maturity date
May 20, 2047
QCOM5410503
Qualcomm Incorporated 4.5% 20-MAY-2052Yield to maturity
6.17%
Maturity date
May 20, 2052
QCOM4246685
Qualcomm Incorporated 4.8% 20-MAY-2045Yield to maturity
5.96%
Maturity date
May 20, 2045
QCOM5500546
Qualcomm Incorporated 6.0% 20-MAY-2053Yield to maturity
5.58%
Maturity date
May 20, 2053
QCOM5086635
Qualcomm Incorporated 1.65% 20-MAY-2032Yield to maturity
5.16%
Maturity date
May 20, 2032
QCOM6081110
Qualcomm Incorporated 5.0% 20-MAY-2035Yield to maturity
5.11%
Maturity date
May 20, 2035
QCIA
QUALCOMM 15/35Yield to maturity
4.92%
Maturity date
May 20, 2035
QCOM6081111
Qualcomm Incorporated 4.75% 20-MAY-2032Yield to maturity
4.78%
Maturity date
May 20, 2032
QCOM5500472
Qualcomm Incorporated 5.4% 20-MAY-2033Yield to maturity
4.69%
Maturity date
May 20, 2033
QCOM5410500
Qualcomm Incorporated 4.25% 20-MAY-2032Yield to maturity
4.67%
Maturity date
May 20, 2032
See all 4QCOM bonds
Curated watchlists where 4QCOM is featured.


Related stocks
Frequently Asked Questions
The current price of 4QCOM is 134.78 EUR — it has decreased by −1.42% in the past 24 hours. Watch QUALCOMM stock price performance more closely on the chart.
Depending on the exchange, the stock ticker may vary. For instance, on EUROTLX exchange QUALCOMM stocks are traded under the ticker 4QCOM.
4QCOM stock has risen by 2.40% compared to the previous week, the month change is a −1.51% fall, over the last year QUALCOMM has showed a −32.91% decrease.
We've gathered analysts' opinions on QUALCOMM future price: according to them, 4QCOM price has a max estimate of 198.05 EUR and a min estimate of 123.23 EUR. Watch 4QCOM chart and read a more detailed QUALCOMM stock forecast: see what analysts think of QUALCOMM and suggest that you do with its stocks.
4QCOM reached its all-time high on Jun 18, 2024 with the price of 215.00 EUR, and its all-time low was 37.62 EUR and was reached on Feb 11, 2016. View more price dynamics on 4QCOM chart.
See other stocks reaching their highest and lowest prices.
See other stocks reaching their highest and lowest prices.
4QCOM stock is 1.44% volatile and has beta coefficient of 1.49. Track QUALCOMM stock price on the chart and check out the list of the most volatile stocks — is QUALCOMM there?
Today QUALCOMM has the market capitalization of 146.62 B, it has increased by 1.98% over the last week.
Yes, you can track QUALCOMM financials in yearly and quarterly reports right on TradingView.
QUALCOMM is going to release the next earnings report on Jul 30, 2025. Keep track of upcoming events with our Earnings Calendar.
4QCOM earnings for the last quarter are 2.63 EUR per share, whereas the estimation was 2.61 EUR resulting in a 1.05% surprise. The estimated earnings for the next quarter are 2.34 EUR per share. See more details about QUALCOMM earnings.
QUALCOMM revenue for the last quarter amounts to 10.02 B EUR, despite the estimated figure of 9.84 B EUR. In the next quarter, revenue is expected to reach 8.90 B EUR.
4QCOM net income for the last quarter is 2.60 B EUR, while the quarter before that showed 3.07 B EUR of net income which accounts for −15.38% change. Track more QUALCOMM financial stats to get the full picture.
Yes, 4QCOM dividends are paid quarterly. The last dividend per share was 0.78 EUR. As of today, Dividend Yield (TTM)% is 2.20%. Tracking QUALCOMM dividends might help you take more informed decisions.
QUALCOMM dividend yield was 1.94% in 2024, and payout ratio reached 36.77%. The year before the numbers were 2.88% and 48.27% correspondingly. See high-dividend stocks and find more opportunities for your portfolio.
As of Jun 14, 2025, the company has 49 K employees. See our rating of the largest employees — is QUALCOMM on this list?
EBITDA measures a company's operating performance, its growth signifies an improvement in the efficiency of a company. QUALCOMM EBITDA is 12.36 B EUR, and current EBITDA margin is 30.69%. See more stats in QUALCOMM financial statements.
Like other stocks, 4QCOM shares are traded on stock exchanges, e.g. Nasdaq, Nyse, Euronext, and the easiest way to buy them is through an online stock broker. To do this, you need to open an account and follow a broker's procedures, then start trading. You can trade QUALCOMM stock right from TradingView charts — choose your broker and connect to your account.
Investing in stocks requires a comprehensive research: you should carefully study all the available data, e.g. company's financials, related news, and its technical analysis. So QUALCOMM technincal analysis shows the buy rating today, and its 1 week rating is neutral. Since market conditions are prone to changes, it's worth looking a bit further into the future — according to the 1 month rating QUALCOMM stock shows the neutral signal. See more of QUALCOMM technicals for a more comprehensive analysis.
If you're still not sure, try looking for inspiration in our curated watchlists.
If you're still not sure, try looking for inspiration in our curated watchlists.