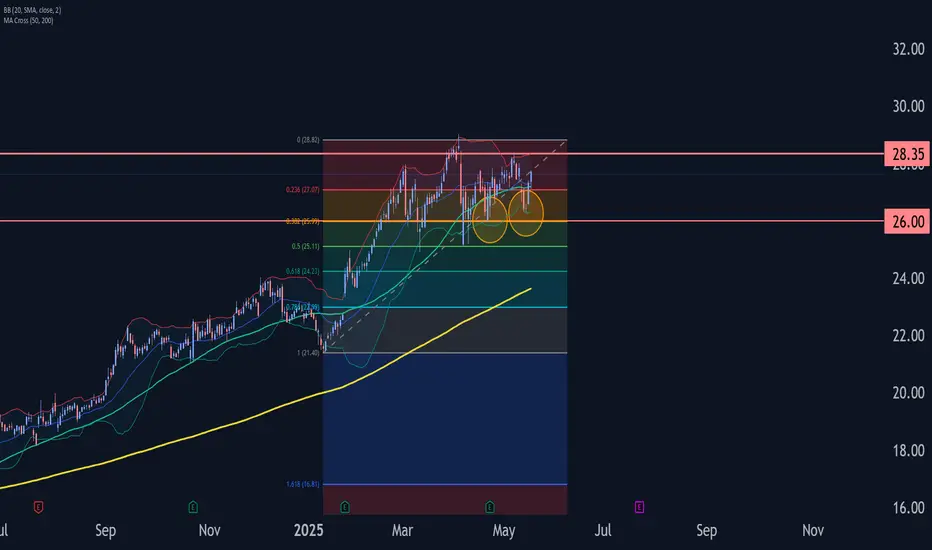
AT&T Wave Analysis – 16 May 2025- AT&T reversed from support zone
- Likely to rise to resistance level 28.35
AT&T recently reversed up with the daily Morning Star from the support zone between the key support level 26.00, 38.2% Fibonacci correction of the upward impulse from January and the lower daily Bollinger Band.
The active
Key facts today
Next report date
—
Report period
—
EPS estimate
—
Revenue estimate
—
1.505 EUR
10.58 B EUR
118.17 B EUR
7.19 B
About AT&T Inc.
Sector
Industry
CEO
John T. Stankey
Website
Headquarters
Dallas
Founded
1983
FIGI
BBG000QFT5K2
AT&T, Inc. is a holding company, which engages in the provision of telecommunications and technology services. It operates through the Communications and Latin America segments. The Communications segment offers wireless, wireline telecom, and broadband services to businesses and consumers located in the US and businesses globally. The Latin America segment provides wireless services and equipment in Mexico. The company was founded in 1983 and is headquartered in Dallas, TX.
Related stocks
AT&T I Tipping Point : Short Opportunity with Head & ShouldersHey traders after a previous trade trade on the hood hitting targets of 16.4%. Today I bring you NYSE:T
Technical + Fundamental View
Pro Tip
- Breakdown below the Entry Line will be considered at Trade Initiation. (Risky Traders)
R:R= 5.4
- Rest can follow entry at day close post breakdow

T Trading Guide 4/21/25AT&T (T) Trading Analysis for Monday, April 21, 2025
Sentiment Analysis
-Overview: Sentiment on X and StockTwits is neutral, with investors appreciating T’s 4.11% dividend yield but expressing concerns over tariff-driven cost increases. Analyst consensus remains stable, with a “Hold” rating and a

T Trade LevelsYou might notice that this is the Hourly timeframe.
For a ticker that moves 0.83 cents/day, I just needed to know the directional bias up top (ranging but leaning bullish).
I would expect day trades to move level to level.
The contracts listed will be your best options whether day or swing tradi

New Setup: TT : I have a swing trade setup signal. Looking to enter long if the stock can manage to CLOSE above the last candle high(BUY). If triggered, I will then place a stop-loss below (SL) and a price target above it(TP Zone) **Note: This setups will remain valid until the stock CLOSES BELOW my stop-loss l

Quantum's T (AT&T) Trading Guide 4/13/25Sentiment: Neutral. Dividend yield (4-5%) and debt reduction ($123B) attract income seekers, but telecom competition and tariff fears limit enthusiasm. X posts praise stability, though growth concerns persist.
Outlook: Neutral, slightly bullish. Options pin $27, with call buying eyeing $28. ICT/SMT

Quantum's T (AT&T) Trading Guide 4/11/25T (AT&T Inc.)
Sentiment
• Sentiment is neutral with a bearish tilt. April 10 options activity shows put-heavy volume at $26 strikes, reflecting caution. RSI (14) at ~50 (estimated, flat trend at $26.40 close) suggests indecision. X posts highlight concerns over telecom debt loads and tariff risks

THERE IS A POTENTIAL BREAKOUT TO THE UPSIDE IN T[AT&T]As we can see market overall is bull due to creation of higher low and higher high, at the moment market is making a pullback before continuing with its direction to the upside. we are looking for long opportunity in this pullback. keep monitoring from one hour.

T: In the meantime, making some heavy stridesAT&T is not something we see in the finance news that often nor has the sexiness of the Silicon Valley names, but, since July of 2023, this company has been on a tier. Seem like the new CEO knows what he's doing and combined with missteps from the competitors, T has seen a 100% move up from the bott

AT&T 1 Month Chart Technical Analysis
Chart Pattern: Bull flag(bullish) broke upwards following upward trend line(green).
Exponential Moving Average: EMA 9(green line) is above EMA 21(red line) bullish
Bollinger Band (BB): AT&T is in the upper band(red) it could be bearish, however, let’s check the volume to make sure this isn’

See all ideas
Summarizing what the indicators are suggesting.
Neutral
SellBuy
Strong sellStrong buy
Strong sellSellNeutralBuyStrong buy
Neutral
SellBuy
Strong sellStrong buy
Strong sellSellNeutralBuyStrong buy
Neutral
SellBuy
Strong sellStrong buy
Strong sellSellNeutralBuyStrong buy
An aggregate view of professional's ratings.
Neutral
SellBuy
Strong sellStrong buy
Strong sellSellNeutralBuyStrong buy
Neutral
SellBuy
Strong sellStrong buy
Strong sellSellNeutralBuyStrong buy
Neutral
SellBuy
Strong sellStrong buy
Strong sellSellNeutralBuyStrong buy
Displays a symbol's price movements over previous years to identify recurring trends.
Curated watchlists where 4T is featured.


Frequently Asked Questions
The current price of 4T is 24.045 EUR — it has decreased by −1.49% in the past 24 hours. Watch AT&T stock price performance more closely on the chart.
Depending on the exchange, the stock ticker may vary. For instance, on EUROTLX exchange AT&T stocks are traded under the ticker 4T.
4T stock has risen by 0.60% compared to the previous week, the month change is a −0.27% fall, over the last year AT&T has showed a 38.29% increase.
We've gathered analysts' opinions on AT&T future price: according to them, 4T price has a max estimate of 27.36 EUR and a min estimate of 15.22 EUR. Watch 4T chart and read a more detailed AT&T stock forecast: see what analysts think of AT&T and suggest that you do with its stocks.
4T stock is 0.67% volatile and has beta coefficient of 0.18. Track AT&T stock price on the chart and check out the list of the most volatile stocks — is AT&T there?
Today AT&T has the market capitalization of 172.73 B, it has decreased by −0.13% over the last week.
Yes, you can track AT&T financials in yearly and quarterly reports right on TradingView.
AT&T is going to release the next earnings report on Jul 23, 2025. Keep track of upcoming events with our Earnings Calendar.
4T earnings for the last quarter are 0.47 EUR per share, whereas the estimation was 0.47 EUR resulting in a 0.13% surprise. The estimated earnings for the next quarter are 0.45 EUR per share. See more details about AT&T earnings.
AT&T revenue for the last quarter amounts to 28.31 B EUR, despite the estimated figure of 28.06 B EUR. In the next quarter, revenue is expected to reach 25.83 B EUR.
4T net income for the last quarter is 4.02 B EUR, while the quarter before that showed 3.94 B EUR of net income which accounts for 2.05% change. Track more AT&T financial stats to get the full picture.
Yes, 4T dividends are paid quarterly. The last dividend per share was 0.25 EUR. As of today, Dividend Yield (TTM)% is 3.92%. Tracking AT&T dividends might help you take more informed decisions.
AT&T dividend yield was 4.87% in 2024, and payout ratio reached 74.41%. The year before the numbers were 6.62% and 56.43% correspondingly. See high-dividend stocks and find more opportunities for your portfolio.
As of Jul 4, 2025, the company has 140.99 K employees. See our rating of the largest employees — is AT&T on this list?
EBITDA measures a company's operating performance, its growth signifies an improvement in the efficiency of a company. AT&T EBITDA is 41.85 B EUR, and current EBITDA margin is 36.65%. See more stats in AT&T financial statements.
Like other stocks, 4T shares are traded on stock exchanges, e.g. Nasdaq, Nyse, Euronext, and the easiest way to buy them is through an online stock broker. To do this, you need to open an account and follow a broker's procedures, then start trading. You can trade AT&T stock right from TradingView charts — choose your broker and connect to your account.
Investing in stocks requires a comprehensive research: you should carefully study all the available data, e.g. company's financials, related news, and its technical analysis. So AT&T technincal analysis shows the sell today, and its 1 week rating is buy. Since market conditions are prone to changes, it's worth looking a bit further into the future — according to the 1 month rating AT&T stock shows the buy signal. See more of AT&T technicals for a more comprehensive analysis.
If you're still not sure, try looking for inspiration in our curated watchlists.
If you're still not sure, try looking for inspiration in our curated watchlists.