6954 - 5 months HEAD & SHOULDERS══════════════════════════════
Since 2014, my markets approach is to spot
trading opportunities based solely on the
development of
CLASSICAL CHART PATTERNS
🤝Let’s learn and grow together 🤝
══════════════════════════════
Hello Traders ✌
After a careful consideration I came to the conclusion that:
-
Next report date
—
Report period
—
EPS estimate
—
Revenue estimate
—
0.99 EUR
909.20 M EUR
4.91 B EUR
879.83 M
About FANUC CORPORATION
Sector
Industry
CEO
Kenji Yamaguchi
Website
Headquarters
Minamitsuru-gun
Founded
1950
ISIN
JP3802400006
FIGI
BBG000BVB8P1
FANUC Corp. engages in the development, manufacture, sale, and maintenance of computer numerical control (CNC) systems, lasers, robot systems, robomachines, robocop, robocut and nano robots. It operates through the following divisions: Factory Automation (FA), Robot, and Robomachine. The FA division provides products that enable factory automation, such as CNCs, which control machine tools with numerical information, servos and laser oscillators. The Robot division tasks can be automated by applying the basic technologies of CNCs and servos freely controlling robot arms. The Robomachine division develops compact machining centers, electric injection molding machines, wire electrical-discharge machines that apply the basic technologies of CNCs and servos. The company was founded by Seiuemon Inaba in 1955 and is headquartered in Minamitsuru-gun, Japan.
Related stocks

FANUC Robotic Manufacturing Assistance JPN future growth FANUF FANUC FANUC CORPORATION is a Japan-based manufacturing company mainly engaged in the provision of factory automation (FA) machinery. The Company operates in three business segments. The FA segment is engaged in the development, manufacture and sale of FA products, such as computer numeric c

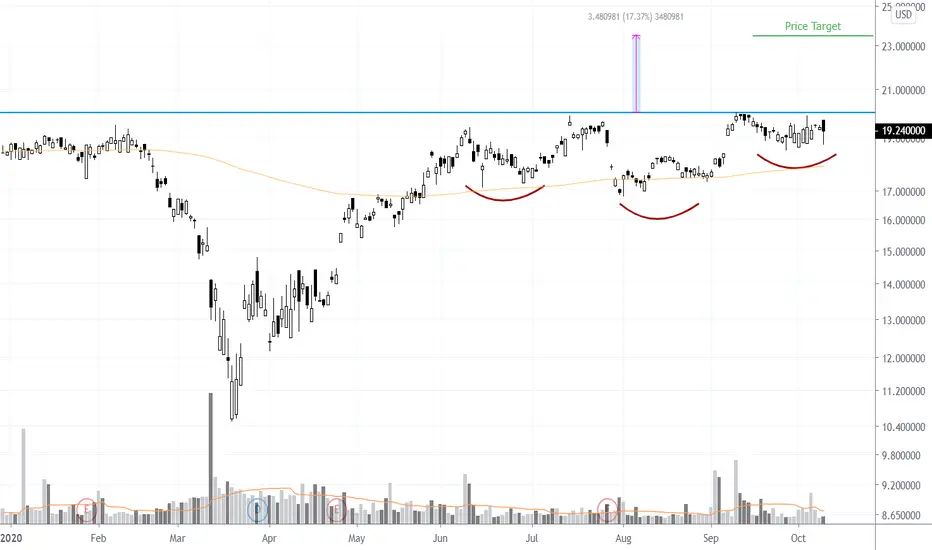
$FANUY 5 Month #HeadandShoulders #Continuation #ChartPatternOTC:FANUY is forming 5 month possible head and shoulder continuation chart pattern. The $20 chart pattern neck line has been tested numerus times through out the years going back all the way to mid 2018 (zoon out to the weekly chart for the bigger picture).
A daily close above $20 will finally br

Fanuc - LongEXPERIENCE IN INTEGRATING AUTOMATION AND ROBOTICS WITH AI - WILL CREATE A NEW BREED OF ROBOTS

See all ideas
Summarizing what the indicators are suggesting.
Neutral
SellBuy
Strong sellStrong buy
Strong sellSellNeutralBuyStrong buy
Neutral
SellBuy
Strong sellStrong buy
Strong sellSellNeutralBuyStrong buy
Neutral
SellBuy
Strong sellStrong buy
Strong sellSellNeutralBuyStrong buy
An aggregate view of professional's ratings.
Neutral
SellBuy
Strong sellStrong buy
Strong sellSellNeutralBuyStrong buy
Neutral
SellBuy
Strong sellStrong buy
Strong sellSellNeutralBuyStrong buy
Neutral
SellBuy
Strong sellStrong buy
Strong sellSellNeutralBuyStrong buy
Displays a symbol's price movements over previous years to identify recurring trends.
Frequently Asked Questions
The current price of FUC is 25.06 EUR — it has decreased by −0.44% in the past 24 hours. Watch FANUC CORP. stock price performance more closely on the chart.
Depending on the exchange, the stock ticker may vary. For instance, on FWB exchange FANUC CORP. stocks are traded under the ticker FUC.
FUC stock has risen by 14.74% compared to the previous week, the month change is a 13.39% rise, over the last year FANUC CORP. has showed a 2.92% increase.
We've gathered analysts' opinions on FANUC CORP. future price: according to them, FUC price has a max estimate of 34.72 EUR and a min estimate of 19.67 EUR. Watch FUC chart and read a more detailed FANUC CORP. stock forecast: see what analysts think of FANUC CORP. and suggest that you do with its stocks.
FUC stock is 4.22% volatile and has beta coefficient of 1.33. Track FANUC CORP. stock price on the chart and check out the list of the most volatile stocks — is FANUC CORP. there?
Today FANUC CORP. has the market capitalization of 22.79 B, it has decreased by −0.79% over the last week.
Yes, you can track FANUC CORP. financials in yearly and quarterly reports right on TradingView.
FANUC CORP. is going to release the next earnings report on Oct 23, 2025. Keep track of upcoming events with our Earnings Calendar.
FUC earnings for the last quarter are 0.24 EUR per share, whereas the estimation was 0.21 EUR resulting in a 13.97% surprise. The estimated earnings for the next quarter are 0.22 EUR per share. See more details about FANUC CORP. earnings.
FANUC CORP. revenue for the last quarter amounts to 1.16 B EUR, despite the estimated figure of 1.16 B EUR. In the next quarter, revenue is expected to reach 1.13 B EUR.
FUC net income for the last quarter is 222.92 M EUR, while the quarter before that showed 275.88 M EUR of net income which accounts for −19.20% change. Track more FANUC CORP. financial stats to get the full picture.
FANUC CORP. dividend yield was 2.32% in 2024, and payout ratio reached 60.00%. The year before the numbers were 2.01% and 60.00% correspondingly. See high-dividend stocks and find more opportunities for your portfolio.
As of Jul 27, 2025, the company has 10.11 K employees. See our rating of the largest employees — is FANUC CORP. on this list?
EBITDA measures a company's operating performance, its growth signifies an improvement in the efficiency of a company. FANUC CORP. EBITDA is 1.26 B EUR, and current EBITDA margin is 25.75%. See more stats in FANUC CORP. financial statements.
Like other stocks, FUC shares are traded on stock exchanges, e.g. Nasdaq, Nyse, Euronext, and the easiest way to buy them is through an online stock broker. To do this, you need to open an account and follow a broker's procedures, then start trading. You can trade FANUC CORP. stock right from TradingView charts — choose your broker and connect to your account.
Investing in stocks requires a comprehensive research: you should carefully study all the available data, e.g. company's financials, related news, and its technical analysis. So FANUC CORP. technincal analysis shows the buy rating today, and its 1 week rating is buy. Since market conditions are prone to changes, it's worth looking a bit further into the future — according to the 1 month rating FANUC CORP. stock shows the sell signal. See more of FANUC CORP. technicals for a more comprehensive analysis.
If you're still not sure, try looking for inspiration in our curated watchlists.
If you're still not sure, try looking for inspiration in our curated watchlists.