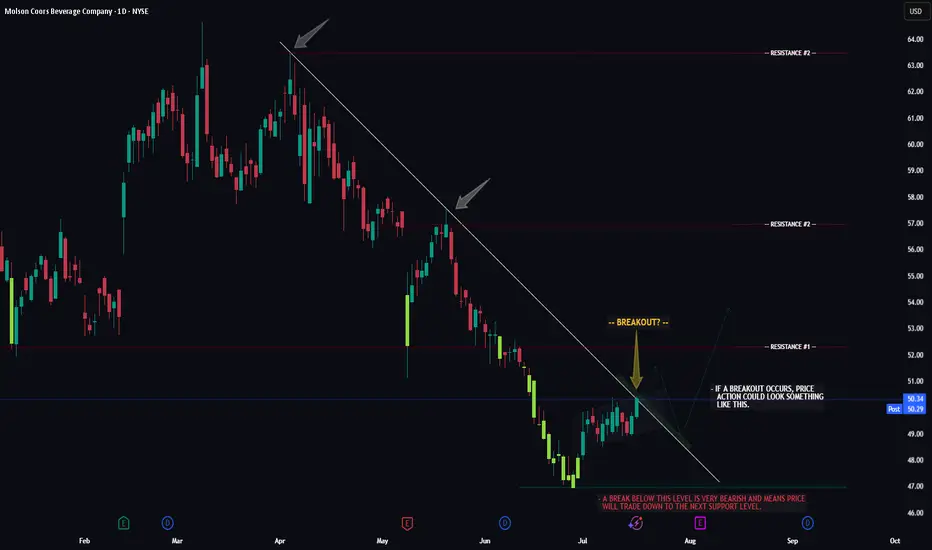
TAP -- Breakout Attempt -- Target LevelsHello Traders!
The chart of TAP (Molson Beer co.) is currently flirting with a major resistance trendline. Now whether or not price can successfully seal the deal and make it too third base remains to be seen.
If price does breakout, watch for a potential retrace to the breakout trendline first, t
Next report date
—
Report period
—
EPS estimate
—
Revenue estimate
—
4.6 EUR
1.08 B EUR
11.23 B EUR
39.30 K
About Molson Coors Beverage Company
Sector
Industry
CEO
Gavin D. K. Hattersley
Website
Headquarters
Golden
Founded
1786
FIGI
BBG00YYZCH36
Molson Coors Beverage Co. is a holding company, which engages in the production and sale of beer. It operates through the Americas and EMEA and APAC geographical segments. The Americas segment imports, markets, distributes, and sells owned brands and partner brands and licensed brands in the U.S., Canada and various countries in Latin America. The EMEA and APAC segment consists of the production, marketing, and sales of primary brands as well as other owned and licensed brands in Bulgaria, Croatia, Czech Republic, Hungary, Montenegro, the Republic of Ireland, Romania, Serbia, the U.K., various other European countries and certain countries within the Middle East, Africa and Asia Pacific regions. The company was founded in 1786 and is headquartered in Golden, CO.
Related stocks
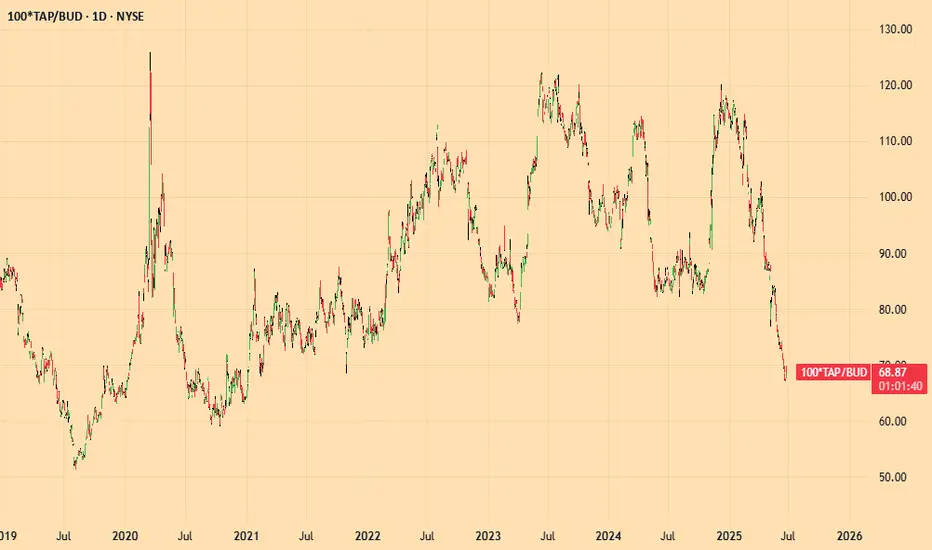
SPREADING BEERI believe that the spread between the 2 major beer firms TAP / BUD will increase 28% from currently 68.89 to 88.18
It might take a few months
I am ready to buy more in the case it falls down to 57.28 in which case my exit will be 73.32
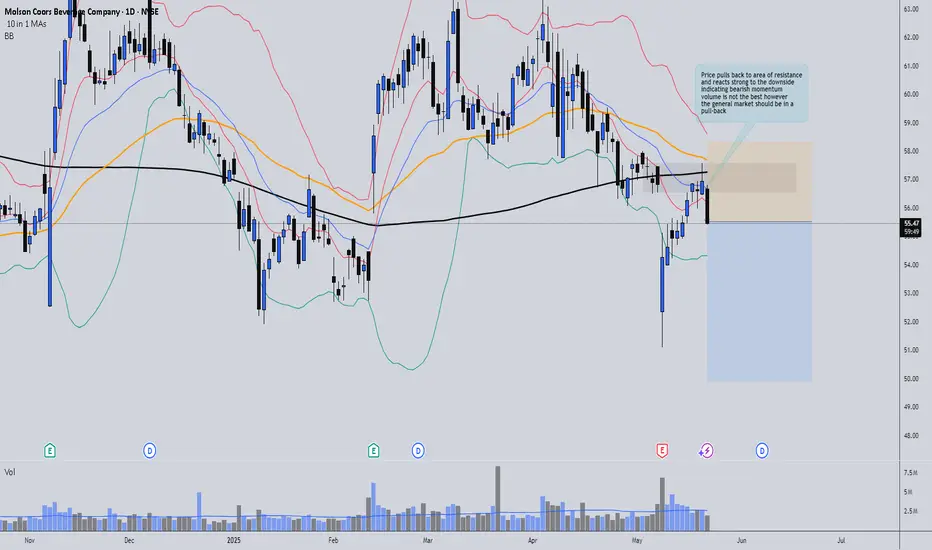
TAP short tradeIn this case, the price has pulled back into a key resistance area but failed to break out. It's also aligned with both the 200 and 20 moving averages, and today we’ve seen a strong bearish reaction from that zone.
Considering this confluence and the current direction of the overall market, I belie
MOLSON COORS Stock Chart Fibonacci Analysis 022625Trading Idea
1) Find a FIBO slingshot
2) Check FIBO 61.80% level
3) Entry Point > 56/61.80%
Chart time frame: D
A) 15 min(1W-3M)
B) 1 hr(3M-6M)
C) 4 hr(6M-1year)
D) 1 day(1-3years)
Stock progress: A
A) Keep rising over 61.80% resistance
B) 61.80% resistance
C) 61.80% support
D) Hit the bottom
E

TAP - The Molson Coors Beverage Company ready for short?
The Molson Coors Beverage Company NYSE:TAP on New York Stock Exchange looks like ready for short. We see here a brake out from the long time resistance with a confirmation from this move. This is maybe the end of the long time correction since october 2020. Next Target 40,00 $?

TAP Molson Coors Beverage Company, LONG (MID-term)Financials
- Earnings are rising, good outlook, bright expectations
- Stock is at a low point, trading under its book values.
Techincal
- Stock is picking up momentum.
- Stock is at a great R/R point.
Strategic
- Stock should be priced way higher in an investment of lowering interest rates

TAP flushed on a good earnings beat into support LONGTAP appears to to have fallen into support on a good earnigns beat Perhaps traders were
expecting a better beat. It is now 15% below the resistance zone where shorts will take
positions and longs will sell- off. TAP has sales and consumer loyalty in its brands. It is
free of the controversi

Tap Double Top or buying opportunity?NYSE:TAP has had a rough time as of late as noted on the weekly chart.
I am torn between the was it a double top or are we entering a buying opportunity here?
If it loses the 53 level it can continue to slide especially if earnings disappoint, on the other hand it could rise if earnings surprise a

TAP ( Coors Molson Miller ) Ready for Bullish Continuation?On the daily chart, TAP was on a good trend up heading into earnings which were favorable.
It is consolidated since just after earnings in a " high tight bull flag pattern" Volume has been
healthy with many buyers and seller trading shares in a tight range channel. The stochastic
RSI is now at a

Molson Coors Brewing Company_buybest entry
100 % correction
low risk
R:R=1:6
Trade in the direction of the market
Godd luck.

See all ideas
Summarizing what the indicators are suggesting.
Neutral
SellBuy
Strong sellStrong buy
Strong sellSellNeutralBuyStrong buy
Neutral
SellBuy
Strong sellStrong buy
Strong sellSellNeutralBuyStrong buy
Neutral
SellBuy
Strong sellStrong buy
Strong sellSellNeutralBuyStrong buy
An aggregate view of professional's ratings.
Neutral
SellBuy
Strong sellStrong buy
Strong sellSellNeutralBuyStrong buy
Neutral
SellBuy
Strong sellStrong buy
Strong sellSellNeutralBuyStrong buy
Neutral
SellBuy
Strong sellStrong buy
Strong sellSellNeutralBuyStrong buy
Displays a symbol's price movements over previous years to identify recurring trends.
US60871RAH3
MOLSON COORS BEV. 16/46Yield to maturity
6.66%
Maturity date
Jul 15, 2046
US60871RAD2
MOLSON COORS BEV. 12/42Yield to maturity
6.18%
Maturity date
May 1, 2042
US60871RAG5
MOLSON COORS BEV. 16/26Yield to maturity
4.78%
Maturity date
Jul 15, 2026
A3LZEX
MOLSON COORS BEVERAGE CO 2024-15.06.32Yield to maturity
3.49%
Maturity date
Jun 15, 2032
See all NY70 bonds
Curated watchlists where NY70 is featured.


Frequently Asked Questions
The current price of NY70 is 45.6 EUR — it has increased by 0.44% in the past 24 hours. Watch MOLSON COORS BEVERAGE A stock price performance more closely on the chart.
Depending on the exchange, the stock ticker may vary. For instance, on FWB exchange MOLSON COORS BEVERAGE A stocks are traded under the ticker NY70.
NY70 stock has fallen by −0.87% compared to the previous week, the month change is a 4.59% rise, over the last year MOLSON COORS BEVERAGE A has showed a −17.09% decrease.
We've gathered analysts' opinions on MOLSON COORS BEVERAGE A future price: according to them, NY70 price has a max estimate of 73.85 EUR and a min estimate of 41.64 EUR. Watch NY70 chart and read a more detailed MOLSON COORS BEVERAGE A stock forecast: see what analysts think of MOLSON COORS BEVERAGE A and suggest that you do with its stocks.
NY70 reached its all-time high on Nov 4, 2022 with the price of 79.6 EUR, and its all-time low was 0.01 EUR and was reached on Jan 19, 2021. View more price dynamics on NY70 chart.
See other stocks reaching their highest and lowest prices.
See other stocks reaching their highest and lowest prices.
NY70 stock is 0.44% volatile and has beta coefficient of −0.04. Track MOLSON COORS BEVERAGE A stock price on the chart and check out the list of the most volatile stocks — is MOLSON COORS BEVERAGE A there?
Today MOLSON COORS BEVERAGE A has the market capitalization of 8.96 B, it has increased by 1.39% over the last week.
Yes, you can track MOLSON COORS BEVERAGE A financials in yearly and quarterly reports right on TradingView.
MOLSON COORS BEVERAGE A is going to release the next earnings report on Aug 5, 2025. Keep track of upcoming events with our Earnings Calendar.
NY70 earnings for the last quarter are 0.46 EUR per share, whereas the estimation was 0.73 EUR resulting in a −36.28% surprise. The estimated earnings for the next quarter are 1.56 EUR per share. See more details about MOLSON COORS BEVERAGE A earnings.
MOLSON COORS BEVERAGE A revenue for the last quarter amounts to 2.13 B EUR, despite the estimated figure of 2.21 B EUR. In the next quarter, revenue is expected to reach 2.63 B EUR.
NY70 net income for the last quarter is 111.85 M EUR, while the quarter before that showed 278.01 M EUR of net income which accounts for −59.77% change. Track more MOLSON COORS BEVERAGE A financial stats to get the full picture.
Yes, NY70 dividends are paid quarterly. The last dividend per share was 0.41 EUR. As of today, Dividend Yield (TTM)% is 3.33%. Tracking MOLSON COORS BEVERAGE A dividends might help you take more informed decisions.
MOLSON COORS BEVERAGE A dividend yield was 2.94% in 2024, and payout ratio reached 32.91%. The year before the numbers were 2.72% and 37.56% correspondingly. See high-dividend stocks and find more opportunities for your portfolio.
As of Jul 27, 2025, the company has 16.8 K employees. See our rating of the largest employees — is MOLSON COORS BEVERAGE A on this list?
EBITDA measures a company's operating performance, its growth signifies an improvement in the efficiency of a company. MOLSON COORS BEVERAGE A EBITDA is 2.26 B EUR, and current EBITDA margin is 22.18%. See more stats in MOLSON COORS BEVERAGE A financial statements.
Like other stocks, NY70 shares are traded on stock exchanges, e.g. Nasdaq, Nyse, Euronext, and the easiest way to buy them is through an online stock broker. To do this, you need to open an account and follow a broker's procedures, then start trading. You can trade MOLSON COORS BEVERAGE A stock right from TradingView charts — choose your broker and connect to your account.
Investing in stocks requires a comprehensive research: you should carefully study all the available data, e.g. company's financials, related news, and its technical analysis. So MOLSON COORS BEVERAGE A technincal analysis shows the neutral today, and its 1 week rating is sell. Since market conditions are prone to changes, it's worth looking a bit further into the future — according to the 1 month rating MOLSON COORS BEVERAGE A stock shows the sell signal. See more of MOLSON COORS BEVERAGE A technicals for a more comprehensive analysis.
If you're still not sure, try looking for inspiration in our curated watchlists.
If you're still not sure, try looking for inspiration in our curated watchlists.