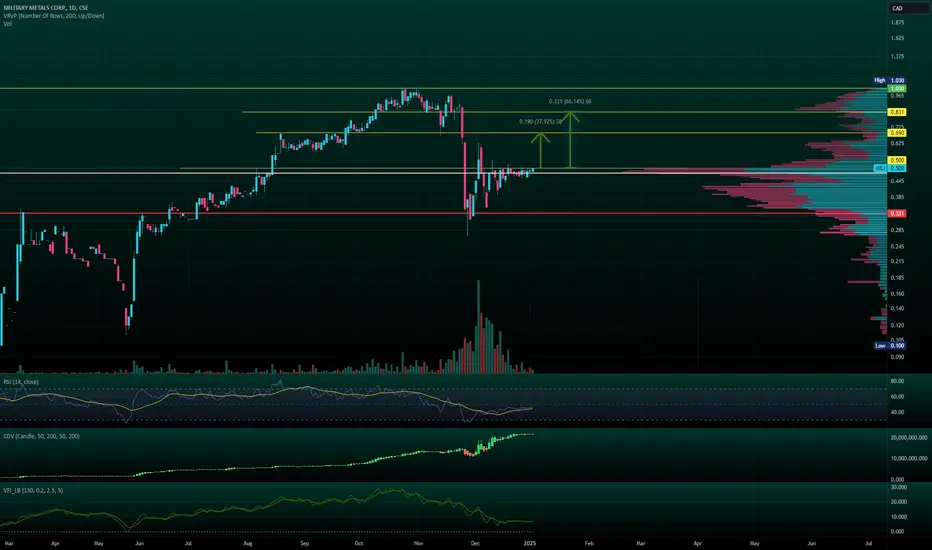
Military Metals - Possible Head & Shoulders with a 2X potential Antimony is a buzz in the mining space. Military Metals is looking to capitalize on China’s market dominance by developing new antimony mines in North America. The chart suggests that the $5 million dollar market cap exploration company could be on the verge of a 2X move. I believe that any purchas
−0.082 EUR
−474.09 K EUR
0.00 EUR
60.78 M
About MILITARY METALS CORP.
Sector
Industry
CEO
Scott Eldridge
Website
Headquarters
Vancouver
Founded
2020
FIGI
BBG018XWH3F3
Military Metals Corp. is a mineral exploration company which holds the Manson Bay Project. The Manson Bay Project is an exploration stage property targeting gold and copper. It is located northwest of Flin Flon, Manitoba’s historic mining center and southwest of the Schotts Lake Copper-Zinc Deposit in Saskatchewan. The company was founded on January 9, 2020 and is headquartered in Vancouver, Canada.
Related stocks

Support formed after selloff, up from here(My other post broke my chart) After a particularly ugly selloff, the price has stabilized around 0.5CAD. I believe the price will move, potentially next week, ultimately reaching 0.69CAD, followed by 0.83CAD. There is certainly potential to move higher, but I wouldn't expect a move past the recent
Buyers soaked up MILI sales in DecemberSimple post - looking at the monthly, the volume in December and notable price stabilization following the massive sell-off in November makes me lean bullish for the short term.
Folks seem to like taking profits in January, but it looks like MILI has already seen its share of profit taking.

Symmetrical triangle and downward continuationMilitary Metals currently has no clear valuation and is entirely speculative. I like their strategy (buying up antimony properties) but they have a cartoonish website and I get weird vibes from them.
In any case, the chart demonstrates a symmetrical triangle and I predict a continued downward trend

See all ideas
Displays a symbol's price movements over previous years to identify recurring trends.
Frequently Asked Questions
Depending on the exchange, the stock ticker may vary. For instance, on FWB exchange MILITARY METALS CORP. stocks are traded under the ticker QN90.
QN90 reached its all-time high on Oct 25, 2024 with the price of 0.685 EUR, and its all-time low was 0.206 EUR and was reached on Nov 29, 2024. View more price dynamics on QN90 chart.
See other stocks reaching their highest and lowest prices.
See other stocks reaching their highest and lowest prices.
Yes, you can track MILITARY METALS CORP. financials in yearly and quarterly reports right on TradingView.
QN90 net income for the last quarter is −1.43 M EUR, while the quarter before that showed −1.66 M EUR of net income which accounts for 13.50% change. Track more MILITARY METALS CORP. financial stats to get the full picture.
No, QN90 doesn't pay any dividends to its shareholders. But don't worry, we've prepared a list of high-dividend stocks for you.
Like other stocks, QN90 shares are traded on stock exchanges, e.g. Nasdaq, Nyse, Euronext, and the easiest way to buy them is through an online stock broker. To do this, you need to open an account and follow a broker's procedures, then start trading. You can trade MILITARY METALS CORP. stock right from TradingView charts — choose your broker and connect to your account.