BBCA - Strong weekly candleBBCA finish this week with strong bullish candle and nice inflow with accumulation.
This week BBCA will face Daily key level at 9900 and potentially BBCA will turn back to Weekly key level at 9300 then bounce back to next Weekly key level 10400.
Other scenario is BBCA will break Daily Key level 9
Next report date
—
Report period
—
EPS estimate
—
Revenue estimate
—
450 IDR
54.84 T IDR
121.06 T IDR
51.47 B
About BANK CENTRAL ASIA
Sector
Industry
CEO
Gregory Hendra Lembong
Website
Headquarters
Jakarta
Founded
1955
ISIN
ID1000109507
FIGI
BBG000CC3P00
PT Bank Central Asia Tbk provides commercial banking and other financial services. It operates through the following segments: Loans, Treasury, and Others. The firm offers deposits account, transaction banking, electronic banking, cash management, credit cards, bank assurance, credit facilities, bank guarantees, export-import facilities, foreign exchange facilities, and investment products. The company was founded on August 10, 1955 and is headquartered in Jakarta, Indonesia.

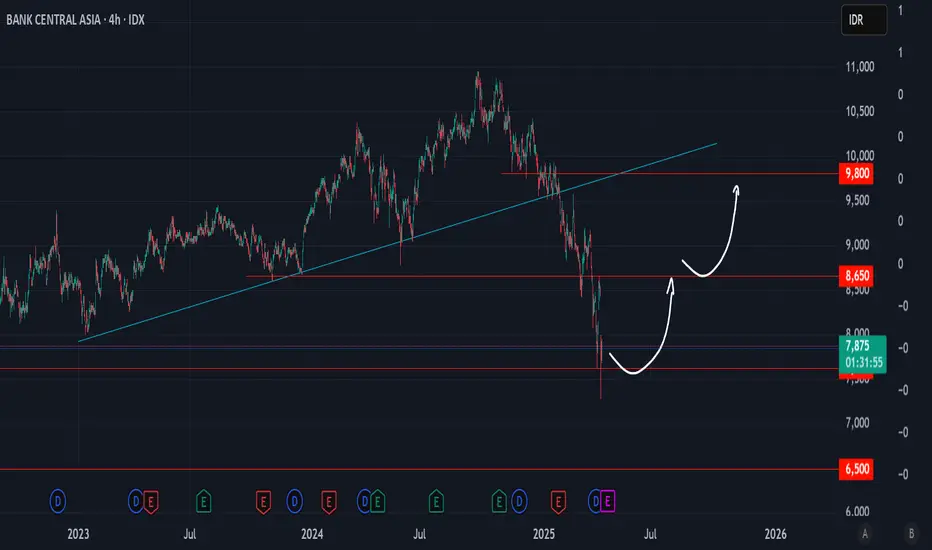
BBCA One of the best timesOne of the best times to buy blue chip stocks from Indonesia which is currently discounted 30% from ATH
Quite simple, if it breaks and closes below 7600 then the bearish trend will continue and maybe we will meet 6500, but if 7600 is strong then we will likely push up with the first target at 8600 t
BBCACurrently BBCA still in bullish trend, I see BBCA will potential correction. If BBCA correction will going to :
support 1 6500
support 2 5500

BBCA My Personal Investment LevelIndonesan BBCA share, personally I'll only start to look for buy while price below 8775. Below 8775 would be ideal for investment.

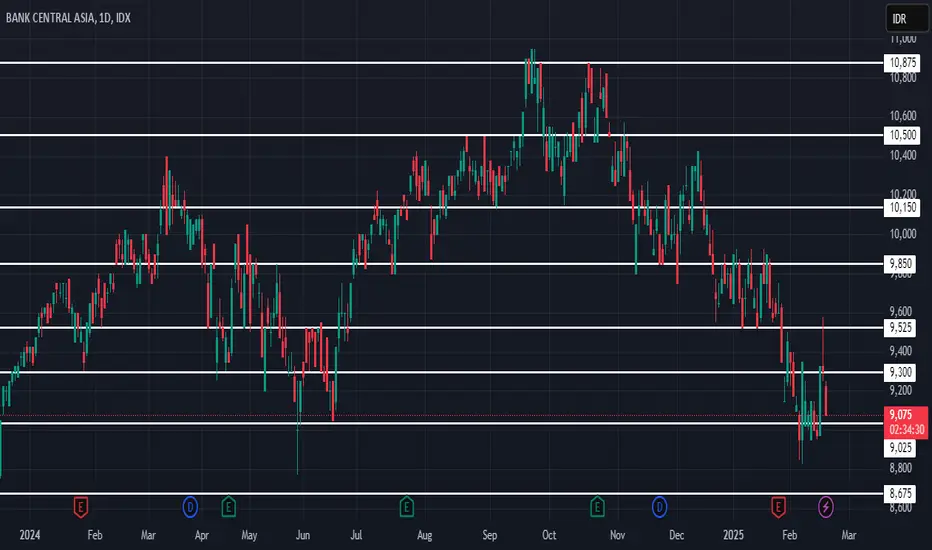
Technical Analysis BBCASupport Levels:
8,675 (Major Support)
9,025 (Minor Support, currently being tested)
Resistance Levels:
9,300 (Nearest Resistance)
9,525 (Next Resistance)
9,850 (Main Resistance in the Short Term)
Trading Plan
1. Buy Area (Entry Point):
Aggressive Buy: 9,025 – 9,100 with a target of 9,300 – 9,525.
C
Posting for FUNSince I am in my free time, .. I'm checking on some local stock market..
This time is BBCA,
The long term idea on the trend might rest for a while around 8200-8500, before continuing it s uptrend. Since nothing go up forever.
Well, not a trading advise though, as me myself is not holding on this

BBCA (VCP - 26W 19/3 3T)IDX:BBCA - VCP
18-09-2024
Reason:
1. Low risk entry point
2. Volume dries up
3. Confirmed Stage 2
4. Price above MA 50 > 150 > 200 over 10 weeks
5. Price is within 25% of 52 weeks high
6. Price is over 30% of 52 weeks low
7. 200 day MA trending up over 1 month
Flaws:
1. RS rating less than 70
2

only up if break 10900 target 12200If we look at the news from 10/23/24, BCCA has an upward trend. If we look at it now, there is little chance of a double top.

#BBCA trade ideaprice is at support, wicked below, can go for one more wick close to S1, can be good short term trade, for higher levels need to break above orange zone

BBCA IdeaYesterday BBCA was down to 9200! i was confused neither hold nor buy more hahaha.
So i decided to buy more BBCA at 9225, base on my chart if BBCA go to 9300-9400 it is time to buy more in my opinion.

See all ideas
Summarizing what the indicators are suggesting.
Neutral
SellBuy
Strong sellStrong buy
Strong sellSellNeutralBuyStrong buy
Neutral
SellBuy
Strong sellStrong buy
Strong sellSellNeutralBuyStrong buy
Neutral
SellBuy
Strong sellStrong buy
Strong sellSellNeutralBuyStrong buy
An aggregate view of professional's ratings.
Neutral
SellBuy
Strong sellStrong buy
Strong sellSellNeutralBuyStrong buy
Neutral
SellBuy
Strong sellStrong buy
Strong sellSellNeutralBuyStrong buy
Neutral
SellBuy
Strong sellStrong buy
Strong sellSellNeutralBuyStrong buy
Displays a symbol's price movements over previous years to identify recurring trends.
Related stocks
Frequently Asked Questions
The current price of BBCA is 8,900 IDR — it has decreased by −1.93% in the past 24 hours. Watch BANK CENTRAL ASIA stock price performance more closely on the chart.
Depending on the exchange, the stock ticker may vary. For instance, on IDX exchange BANK CENTRAL ASIA stocks are traded under the ticker BBCA.
BBCA stock has fallen by −2.20% compared to the previous week, the month change is a −4.04% fall, over the last year BANK CENTRAL ASIA has showed a −3.26% decrease.
We've gathered analysts' opinions on BANK CENTRAL ASIA future price: according to them, BBCA price has a max estimate of 12,500.00 IDR and a min estimate of 8,000.00 IDR. Watch BBCA chart and read a more detailed BANK CENTRAL ASIA stock forecast: see what analysts think of BANK CENTRAL ASIA and suggest that you do with its stocks.
BBCA reached its all-time high on Sep 24, 2024 with the price of 10,950 IDR, and its all-time low was 25 IDR and was reached on May 31, 2000. View more price dynamics on BBCA chart.
See other stocks reaching their highest and lowest prices.
See other stocks reaching their highest and lowest prices.
BBCA stock is 1.97% volatile and has beta coefficient of 0.89. Track BANK CENTRAL ASIA stock price on the chart and check out the list of the most volatile stocks — is BANK CENTRAL ASIA there?
Today BANK CENTRAL ASIA has the market capitalization of 1,118.71 T, it has decreased by −2.59% over the last week.
Yes, you can track BANK CENTRAL ASIA financials in yearly and quarterly reports right on TradingView.
BANK CENTRAL ASIA is going to release the next earnings report on Jul 23, 2025. Keep track of upcoming events with our Earnings Calendar.
BBCA earnings for the last quarter are 114.75 IDR per share, whereas the estimation was 113.09 IDR resulting in a 1.47% surprise. The estimated earnings for the next quarter are 116.42 IDR per share. See more details about BANK CENTRAL ASIA earnings.
BANK CENTRAL ASIA revenue for the last quarter amounts to 27.93 T IDR, despite the estimated figure of 28.03 T IDR. In the next quarter, revenue is expected to reach 28.13 T IDR.
BBCA net income for the last quarter is 14.15 T IDR, while the quarter before that showed 13.76 T IDR of net income which accounts for 2.79% change. Track more BANK CENTRAL ASIA financial stats to get the full picture.
BANK CENTRAL ASIA dividend yield was 3.10% in 2024, and payout ratio reached 67.44%. The year before the numbers were 2.87% and 68.43% correspondingly. See high-dividend stocks and find more opportunities for your portfolio.
As of Jun 18, 2025, the company has 27.84 K employees. See our rating of the largest employees — is BANK CENTRAL ASIA on this list?
Like other stocks, BBCA shares are traded on stock exchanges, e.g. Nasdaq, Nyse, Euronext, and the easiest way to buy them is through an online stock broker. To do this, you need to open an account and follow a broker's procedures, then start trading. You can trade BANK CENTRAL ASIA stock right from TradingView charts — choose your broker and connect to your account.
Investing in stocks requires a comprehensive research: you should carefully study all the available data, e.g. company's financials, related news, and its technical analysis. So BANK CENTRAL ASIA technincal analysis shows the sell today, and its 1 week rating is sell. Since market conditions are prone to changes, it's worth looking a bit further into the future — according to the 1 month rating BANK CENTRAL ASIA stock shows the neutral signal. See more of BANK CENTRAL ASIA technicals for a more comprehensive analysis.
If you're still not sure, try looking for inspiration in our curated watchlists.
If you're still not sure, try looking for inspiration in our curated watchlists.