−132 IDR
−971.80 B IDR
27.83 T IDR
3.64 B
About BUMA INTERNASIONAL GRUP TBK
Sector
Industry
CEO
Ronald Sutardja
Website
Headquarters
Jakarta
Founded
1990
ISIN
ID1000110505
FIGI
BBG000JC9Q14
PT Buma Internasional Grup Tbk is an investment holding company, which engages in the provision of coal mining, mining services, and investment. It operates through the Coal Mining and Mining Services, and Investment segments. The company was founded on November 26, 1990 and is headquartered in Jakarta, Indonesia.
Related stocks

DOID Analysis with Wyckoff SchematicSome analysis on DOID using Wyckoff Schematic, is breaking out of accumulation phase, expecting some rally and markup in prices. Still bullish in my opinion.
Disclaimer: DYOR.


DOID - Pasca Libur Lebaran 2022DOID
sektor = COAL
teknikal = inverted head & shoulder, MA50, MACD
Buy = 515
StopLoss = 460
TargetPrice1 = 610
TargetPrice2 = 740

Doid GassssIDX:DOID
Technical good
Good Accumulation
Disc On
Disclaimer on
Do your own research Before buy!!

IDX: DOID FOR NEXT WEEK MEDIUM RESISTANCE AT 380
MEDIUM SUPPORT AT 320
I PREFER YELLOW TRADING PLAN
Disclaimer:
This information is for educational purposes and is not an investment recommendation or representative of professional expertise. This analysis used herein is for illustration purposes only. This personal opini
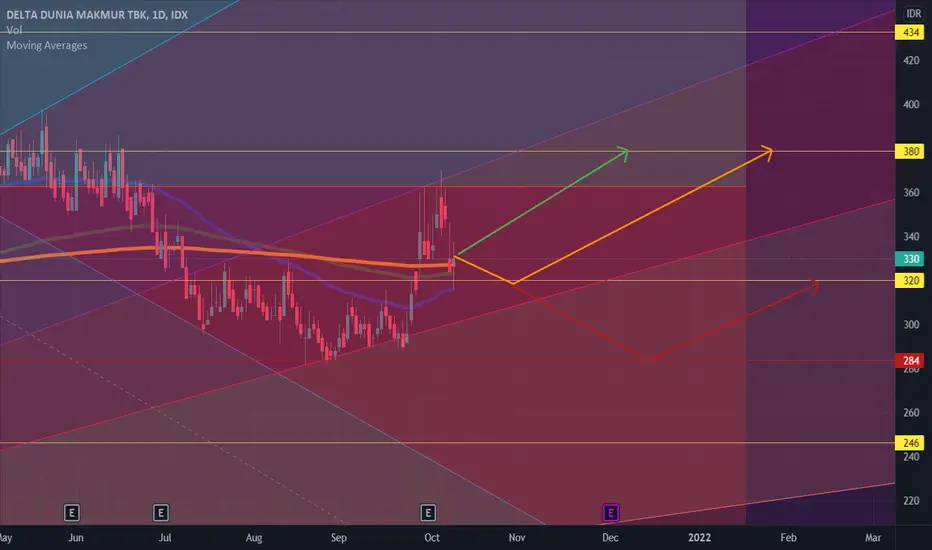
IDX: DOID FOR NEXT WEEKMEDIUM SUPPORT 320
MEDIUM RESISTANCE 380
I PREFER YELLOW TRADING PLAN
Disclaimer:
This information is for educational purposes and is not an investment recommendation or representative of professional expertise. This analysis used herein is for illustration purposes only. This personal opinion sho

idx: DOID daily | buy 376 | 104 Lot | risk/reward 500K idridx: DOID daily | buy 376 | 104 Lot | risk/reward 500K idr

Doid in sidewaysDoid price seems respecting the support area (green line) several times, so i decided that is where i buy and hold.
The price movement still in sideways formation which can be seen by the price rejecting resistance and support area several time.
The volume itself still low.

DOID "Breakout" Triangle PatternDOID: Strong Bearish Ichimoku; Bearish Stochastic (%K = 33.33); Bearish MACD (MACD Level = -1.58);

See all ideas
Summarizing what the indicators are suggesting.
Oscillators
Neutral
SellBuy
Strong sellStrong buy
Strong sellSellNeutralBuyStrong buy
Oscillators
Neutral
SellBuy
Strong sellStrong buy
Strong sellSellNeutralBuyStrong buy
Summary
Neutral
SellBuy
Strong sellStrong buy
Strong sellSellNeutralBuyStrong buy
Summary
Neutral
SellBuy
Strong sellStrong buy
Strong sellSellNeutralBuyStrong buy
Summary
Neutral
SellBuy
Strong sellStrong buy
Strong sellSellNeutralBuyStrong buy
Moving Averages
Neutral
SellBuy
Strong sellStrong buy
Strong sellSellNeutralBuyStrong buy
Moving Averages
Neutral
SellBuy
Strong sellStrong buy
Strong sellSellNeutralBuyStrong buy
Displays a symbol's price movements over previous years to identify recurring trends.
P
PTBK5119257
PT Bukit Makmur Mandiri Utama 7.75% 10-FEB-2026Yield to maturity
7.93%
Maturity date
Feb 10, 2026
See all DOID bonds
Frequently Asked Questions
The current price of DOID is 430 IDR — it has decreased by −2.71% in the past 24 hours. Watch BUMA INTERNASIONAL GRUP TBK stock price performance more closely on the chart.
Depending on the exchange, the stock ticker may vary. For instance, on IDX exchange BUMA INTERNASIONAL GRUP TBK stocks are traded under the ticker DOID.
DOID stock has fallen by −12.24% compared to the previous week, the month change is a −14.85% fall, over the last year BUMA INTERNASIONAL GRUP TBK has showed a −8.51% decrease.
DOID reached its all-time high on Aug 28, 2009 with the price of 2,142 IDR, and its all-time low was 28 IDR and was reached on Mar 3, 2006. View more price dynamics on DOID chart.
See other stocks reaching their highest and lowest prices.
See other stocks reaching their highest and lowest prices.
DOID stock is 6.07% volatile and has beta coefficient of 0.94. Track BUMA INTERNASIONAL GRUP TBK stock price on the chart and check out the list of the most volatile stocks — is BUMA INTERNASIONAL GRUP TBK there?
Today BUMA INTERNASIONAL GRUP TBK has the market capitalization of 3.20 T, it has decreased by −8.30% over the last week.
Yes, you can track BUMA INTERNASIONAL GRUP TBK financials in yearly and quarterly reports right on TradingView.
DOID net income for the last quarter is −748.32 B IDR, while the quarter before that showed 199.24 B IDR of net income which accounts for −475.60% change. Track more BUMA INTERNASIONAL GRUP TBK financial stats to get the full picture.
As of Jun 21, 2025, the company has 15.81 K employees. See our rating of the largest employees — is BUMA INTERNASIONAL GRUP TBK on this list?
EBITDA measures a company's operating performance, its growth signifies an improvement in the efficiency of a company. BUMA INTERNASIONAL GRUP TBK EBITDA is 4.95 T IDR, and current EBITDA margin is 17.78%. See more stats in BUMA INTERNASIONAL GRUP TBK financial statements.
Like other stocks, DOID shares are traded on stock exchanges, e.g. Nasdaq, Nyse, Euronext, and the easiest way to buy them is through an online stock broker. To do this, you need to open an account and follow a broker's procedures, then start trading. You can trade BUMA INTERNASIONAL GRUP TBK stock right from TradingView charts — choose your broker and connect to your account.
Investing in stocks requires a comprehensive research: you should carefully study all the available data, e.g. company's financials, related news, and its technical analysis. So BUMA INTERNASIONAL GRUP TBK technincal analysis shows the strong sell today, and its 1 week rating is sell. Since market conditions are prone to changes, it's worth looking a bit further into the future — according to the 1 month rating BUMA INTERNASIONAL GRUP TBK stock shows the sell signal. See more of BUMA INTERNASIONAL GRUP TBK technicals for a more comprehensive analysis.
If you're still not sure, try looking for inspiration in our curated watchlists.
If you're still not sure, try looking for inspiration in our curated watchlists.