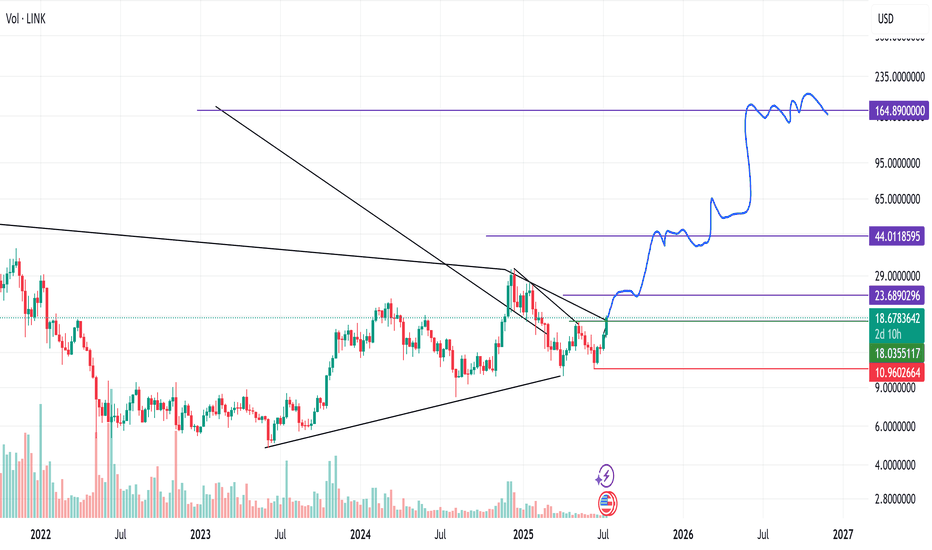
$LINK Golden Cross Confirmed on DailyChainlink is looking extremely bullish here.
Closed above the 50% Gann Level and just had a GOLDEN CROSS.
Normally we see a pullback once this happens, but no sign of slowing down yet from CRYPTOCAP:LINK
Also worth noting LINK is breaking above the 50DMA against ETH.
This was added confirmation for the breakout with ETH / BTC.
Remember the rotation for Alt Season:
BTC > ETH > LARGE CAPS (pending) > Mid Caps > Micro Caps
LINKUSD trade ideas
LINK/USD – Breakout BrewingLINK rebounded sharply off the $16.30 support, pushing above the 200 SMA and now knocking on the door at $16.80–$16.85 resistance. RSI is pushing near 55, indicating growing strength. A breakout above $16.85 could lead to a swift extension toward $17.20+, especially with volume picking up.
🟢 LONG bias above $16.85 – breakout candidate.
🔴 Below $16.80, watch for fakeouts and potential trap pullbacks.
📊 Keywords: #LINKUSD #BreakoutPlay #SMAFlip #MomentumShift #CompressionZone #BullsOnDeck
Almost $100 - Chainlink weekly update August 5 - 11thFrom an Elliott Wave perspective, there are currently three valid scenarios for Chainlink’s price action. Two of them are bullish across the short-, mid-, and long-term timeframes, while one scenario allows for a deeper correction in the short- to mid-term before the broader uptrend resumes.
The favoured scenario suggests we are in the early stages of a Wave 3 impulse, following a clean Wave 2 retracement that reached the 0.5 Fibonacci level — a textbook technical setup. This interpretation is supported not only by the internal wave structure but also by similarities to other crypto assets showing impulsive characteristics. Additionally, there is notable liquidity sitting above the current price, which could act as a magnet for a Wave 3 extension. Accumulation zones and bullish order blocks are also forming on correlated assets like Solana, and Cardano is showing a near-identical wave structure — a setup that has proven reliable in previous cycles.
The shift in funding rates from negative to positive supports this bullish thesis, indicating growing confidence among long-positioned traders. However, it’s worth noting that open interest has not yet increased in parallel, suggesting a lack of conviction or participation from larger players at this stage — a divergence that deserves close monitoring.
The liquidity heatmap shows clusters of stop liquidity above the current price — consistent with a bullish breakout — but also highlights resting liquidity below. In this context, it is crucial that the current local low holds. Ideally, price should break above both the Wave B and Wave 1 highs to confirm upward momentum and invalidate the bearish alternative.
In the bearish scenario, the structure would still be considered corrective, targeting a retest of the $12 region before any sustainable bullish continuation. This would represent a deeper Wave 2 or Wave B retracement, shaking out weaker hands before the next leg up.
From a risk/reward perspective, current levels still offer a compelling long opportunity — but invalidation below the recent low would open the door to the $12 area. Until then, the impulsive structure remains intact and favoured.
Chainlink ($LINK) – The Make-or-Break ZoneWe’re now entering what I believe could be one of the most important price regions for Chainlink in its entire trading history.
On the monthly chart, LINK has been forming a textbook bullish structure since bottoming in mid-2022 — higher lows, strong rebounds from trendline support, and steady momentum building over time. Price is now pushing into a major resistance zone that has capped rallies for years (highlighted in grey).
Here’s why this level matters:
Historical Significance: Every time LINK has tested this zone in the past, it’s been rejected sharply. A monthly close above would mark a structural shift in market behavior.
Psychological Breakout: Breaking above this region could flip long-term sentiment from cautious optimism to full-on bullish conviction.
Technical Structure: We’ve respected the ascending channel perfectly. The upper trendline break, coupled with the reclaim of prior highs, would open the door for a larger impulsive move.
If LINK can close above this resistance on the monthly, I believe we may never see prices below it again — similar to what happened with previous crypto cycle leaders after key breakout moments.
Upside targets (Fibonacci projections and prior structures):
First major target: $36
Next key level: $53
If momentum accelerates, $196+ becomes possible over a longer horizon.
The structure is primed, momentum is brewing, and the next few monthly candles could determine whether LINK enters a new phase of price discovery.
LINK/ USD 4 Hour ChartHello traders. Looking at the 4 hour chart, we can see we are coming to an area of possible support. For me, I am going to wait to see if we can get one more push down towards the red candle marked on the chart. So if we can push down to the $17 / $19 area, that would be a great buy opportunity. Big G gets a shout out. Be well and trade the trend. I have been away from the charts today, and I will post a gold chart shortly. Thanks for checking out my LINK analysis. Be well and trade the trend.
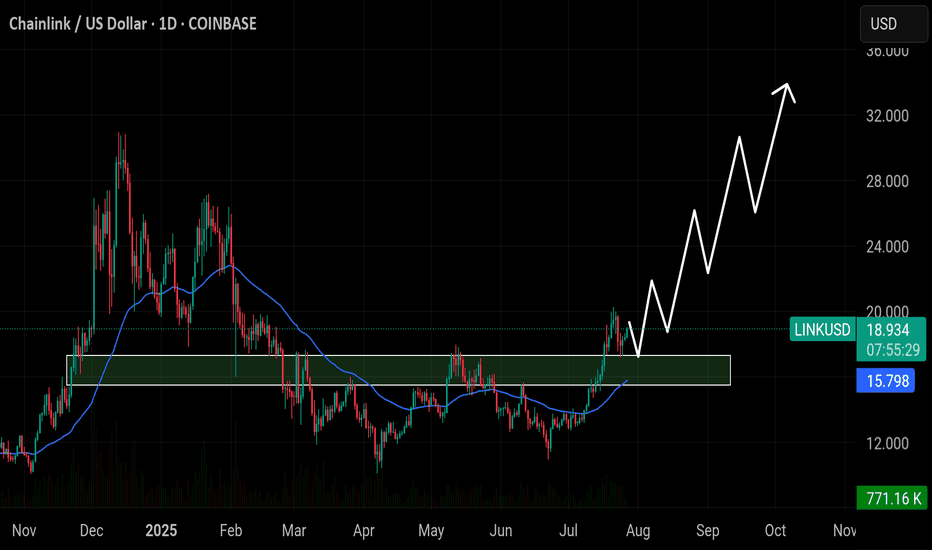
$LINK has retested the $15.80 breakout zone and bounced stronglyBIST:LINK has retested the $15.80 breakout zone and bounced strongly. Price is now gaining momentum and holding above the 50EMA. As long as this zone holds, LINK is likely to push toward $24, $28, and $32 in the coming weeks. A break below $15.0 would invalidate this bullish setup.
LinkUsdt ready to outperform EtheriumHi Everyone,
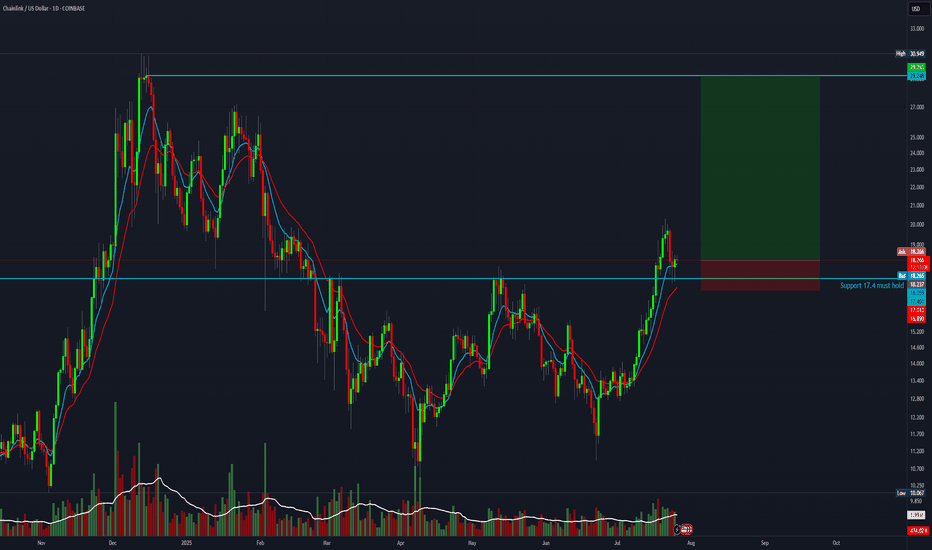
Looking at chart, chainlink is looking primed to close above 20 dollar. if that happens i would anticipate strong upward pressure taking the prices high to 28 dollar and extended target of 38 dollar.
As chart is suggesting strong trendline holding very well as support.
On daily, Macd is above 0 and looking to crossover, indicating strong momemtum might come if than happens.
I have also looked at chainlink against Etherium and it is at longterm trendline support.
Everything points to the fact that if chainlink price close above 20 on daily, strong upward pressure would come.
I have given same price analysis on Xrp in the past and it has performed very well within 3 days of posting the chart
look into my chart history and find xrp if you would like to understand the impact of these closures.
Not financial advise
Best of luck
Like and subscribe for more analysis
LINK Macro signs pointing towards a buyHi,
This is a Macro analysis on the 1 Month timeframe for LINKUSD pair.
I've been looking for opportunities to trade in altcoin market. With BTC in price discovery mode and other signs appearing like altcoin only market cap charts point towards liquidity coming in, it is important now than ever to be spending time to scope out opportunities here.
I do think that not all altcoins will behave the same, im trying to use TA to find those with strong technicals.
LINKUSD sticks out due to several factors.
1. We are in an ascending channel, that i believe currently price action will eventually attempt to reach the upper trend line. (We could be at the very moment be attempting this.)
2. Momentum indicators are flashing bullish, though note that there is still a long way to go for the current monthly candle to close.
Both MACD and STOCH RSI are flashing buys in my opinion.
If our August Candle closes with:
MACD flashing histogram bar as deep green with bullish cross and
STOCH RSI flashing bullish cross and cross occurs above the 20 line.
This would indicate a potential for Macro Bullish move to the upside. ANd i believe that move to be at the very least to the previous highs, if not to new all time highs.
For the 1Month to stay bullish, we need to look for more bullish evidence such as in lower timeframes like the 1 week or 3 day to support 1 Month changes. And Bulls need to maintain dominance in those timeframes for 1 Month to print bullish.
Stay tuned for more updates.
Extreme greed - LINK weekly update August 12 - 18thFrom an Elliott Wave perspective, Chainlink is currently in Minor degree Wave 5 within Intermediate degree Wave 3. On a broader scale, LINK has completed a 1–2 structure at both the Primary and Intermediate degrees, similar to many other altcoins I have analysed recently, and is now advancing as part of Cycle degree Wave 1.
Liquidity positioning shows a substantial build-up below current price. The recent impulsive rally was largely driven by a short squeeze, as many traders opened short positions during Wave 4 and were subsequently liquidated. The order book also shows heavy order clusters above price, aligning closely with the key Fibonacci extension levels.
Funding rates, however, paint a more cautionary picture. They are currently at extremely high positive levels, while open interest has spiked sharply — suggesting that this leg higher is standing on shaky ground. Such conditions often precede volatility spikes or corrective pullbacks. Additionally, momentum indicators like the RSI are showing overbought conditions.
Given the current structure and liquidity alignment, the 1.618 Fibonacci extension remains my preferred target for the completion of this Minor Wave 5, as it coincides with a significant concentration of orders and fits the overall Elliott Wave projection. That said, the combination of overheated funding rates, elevated open interest, and extreme momentum readings warrants high caution for traders.
As always — do your own research, and trade safe.
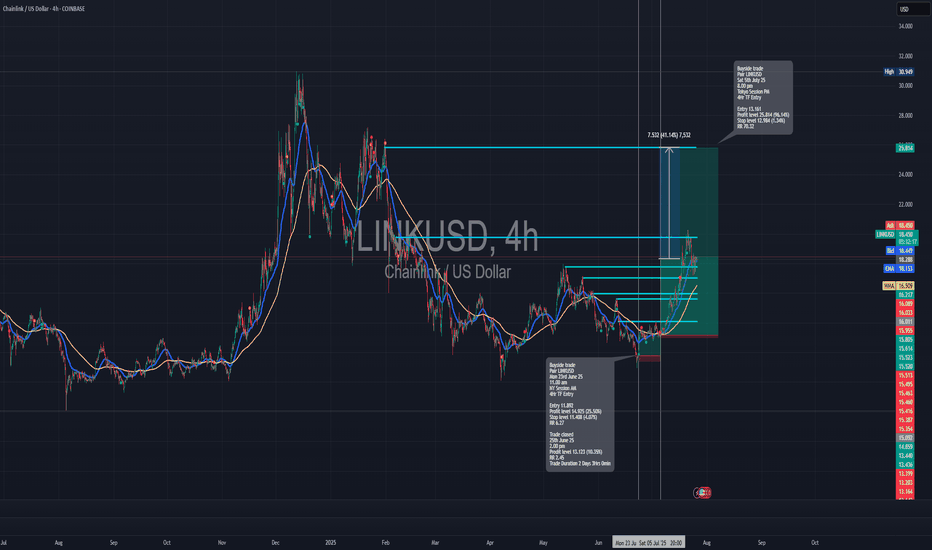
LINK Macro trend LINK 4h+ Link has bottomed out, accumulated in the yellow box, creating large volume node, deviated once to lower price to thin spike volume area which is by little higher PoC, I still think that thick PoC at the yellow box is much valuable. Played out Power of 3, taking out February supply, pulled back to GP Fibbs from the yelllow box and now broke MS ( market structure) to bullish on 1-4H . It will either pump all the way up, or will print higher high-higher low and it will be point of long entry.
Long trade www.tradingview.com
🟢 Buyside Trade
Pair: LINKUSD
Date: Saturday, 5th July 2025
Time: 8:00 PM
Session: Tokyo Session PM
Time Frame: 4Hr TF Entry
🔢 Trade Metrics
Entry Price: 13.161
Take Profit (TP): 25.814 (+96.14%)
Stop Loss (SL): 12.984 (−1.34%)
Risk-Reward Ratio: 70.32: 1
📈 Chart Analysis
Structure: Price broke the previous consolidation zone and retested key support levels near the 13.16 area before launching upward.
Indicators:
200 WMA (Yellow) & 50 EMA (Blue) both support continuation.
Break of market structure confirmed prior resistance as new support.
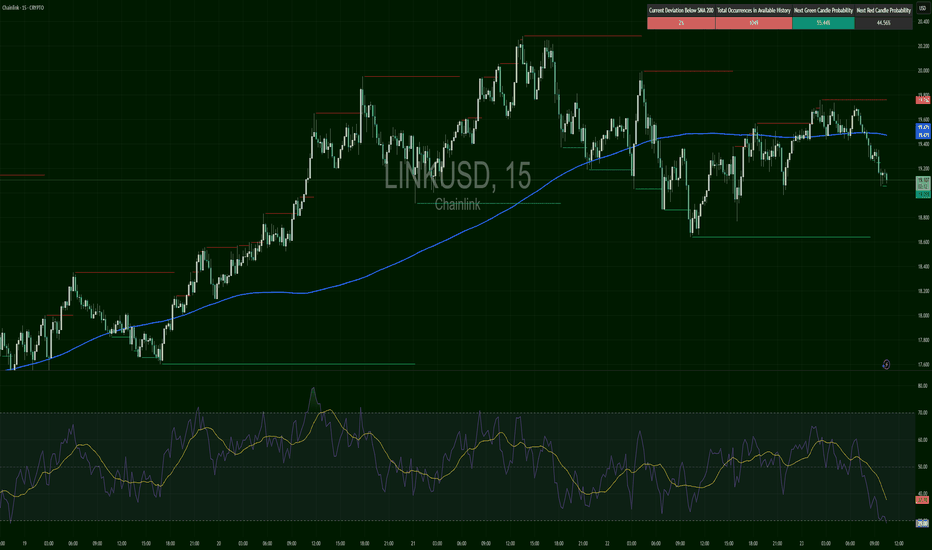
LINKUSD – Structure Snapped, Momentum GoneLINK broke trend structure clearly. After peaking around $19.76, it rolled over, crossing below the 200 SMA. RSI hit 30.54 — deeply oversold. Price is now compressing near $19.05. A rejection from $19.20–$19.30 would confirm bearish continuation. However, if RSI bounces above 40+ and price flips $19.35, it could fake out bears.
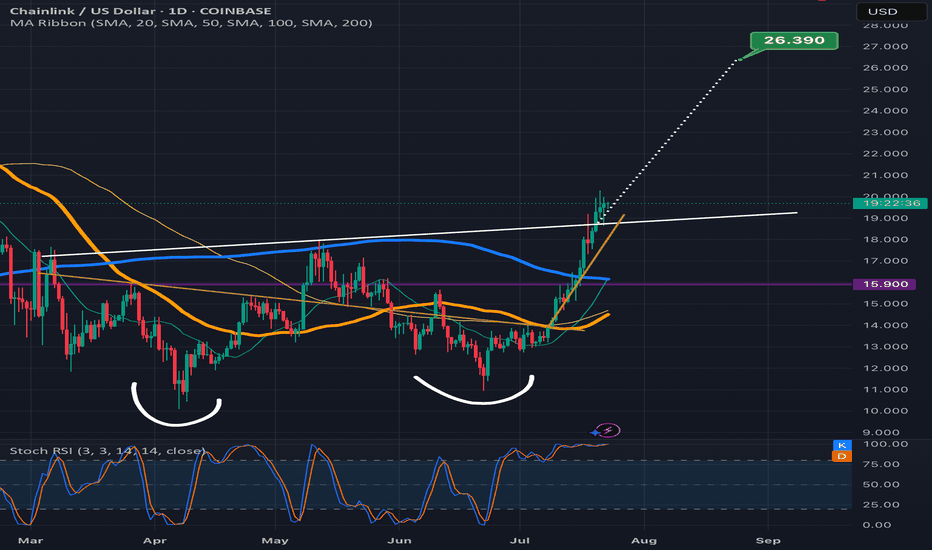
Chainlink climbing the measured move line staircaseLooks like Chanlink is ready to confirm the double bottom breakout here as the past few candles have already started to climb up the measured move line like a staircase.Always possible for a dip back below the neckline at this point but probability slightly favors the readout being validated instead for now. *not financial advice*


