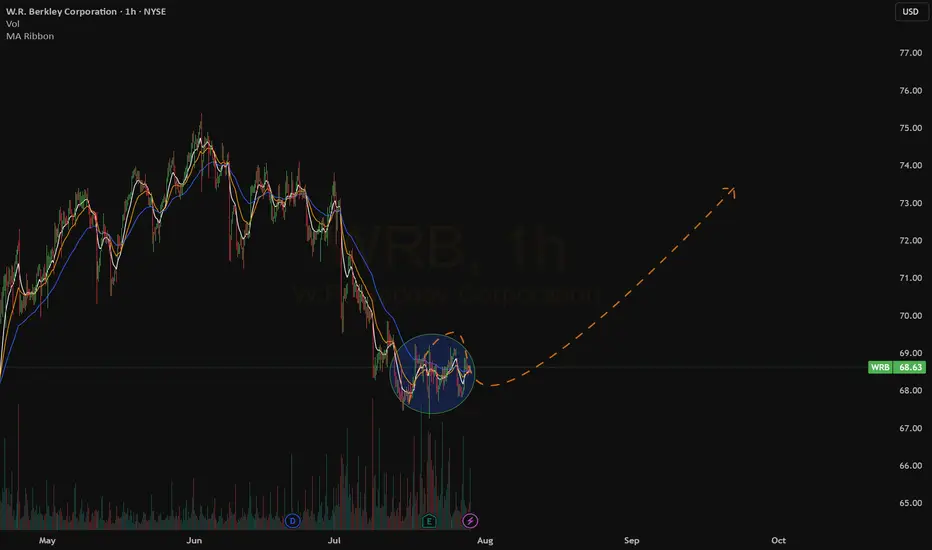
New Setup : WRBConslidation area at $68-$69 with emas that are now flat.
The hourly chart looks good to me without earnings right now.
An action higher will create a enw ATR Alert as well
Ready To catch it !
Next report date
—
Report period
—
EPS estimate
—
Revenue estimate
—
4.4 USD
1.76 B USD
13.64 B USD
296.94 M
About W.R. Berkley Corporation
Sector
Industry
CEO
William Robert Berkley
Website
Headquarters
Greenwich
Founded
1967
FIGI
BBG00JRY9T47
W.R. Berkley Corp. is an insurance holding company, which engages in the property casualty insurance business. It operates through the following segments: Insurance and Reinsurance & Monoline Excess. The Insurance segment includes excess and surplus lines, admitted lines, and specialty personal lines throughout the United States, as well as insurance businesses in the United Kingdom, Continental Europe, South America, Canada, Mexico, Scandinavia, Asia, and Australia. The Reinsurance & Monoline Excess segment is involved in the reinsurance business on a facultative and treaty basis, primarily in the United States, United Kingdom, Continental Europe, Australia, the Asia-Pacific region, and South Africa. The company was founded by William R. Berkley in 1967 and is headquartered in Greenwich, CT.
Related stocks
moving down to supportA small move of 66 or less is incoming; expect a retrace. The swing could take a while, and there's no rush for stochastic to move significantly.

W.R. Berkley (WRB): Insurance Stock Eyes Next Bullish MoveW.R. Berkley Corporation (WRB) is a leader in the commercial property and casualty insurance space, offering specialty coverage through a wide network of independently operating businesses. With a strong focus on underwriting discipline and long-term risk management, the company continues to expand

WRB RotationTesting a few technical indicators during a cyclical rotation here:
- Volume Profile
-- 50 day lookback "Quarterly PoC" | Price is at PoC
-- 100 day lookback "Power PoC" | Price is at PoC
-- PoC Price | Blue = Long
- 200 Day Moving Average
- provides baseline for Long/Short basis | Price > MA = Lon

Short, target 60.97Following weekly chart.
I got a short signal from my power indicator, now let's check where it should go.
Following fibonacci level and support levels, I see a big opportunity between 60.92-61.62
Also we have a gap in 60.92 which supports this idea.
There might be still an uptrend, my stop loss le

$WRB with a bullish outlook following its earnings #StocksThe PEAD projected a bullish outlook for NYSE:WRB after a negative under reaction following its earnings release placing the stock in drift D with an expected accuracy of 60%.

W.R. Berkley (WRB) Long PositionW.R. Berkley (WRB) is an undervalued stock in the insurance sector, with strong fundamentals and positive earnings outlook, making it a potential buy, especially after the recent dip in price. A long position with a price target of $61.24 looks attractive, but setting a tight stop-loss around $50 is

$WRBWRB is having formation of I&H continuation pattern , pattern would be valid 3% above the neckline

WRB daily bearish hammer at all time highWRB daily bearish hammer at all time high would expect at least ABC correction

WRB daily - possible bullish tradeWRB is a strong/bullish fundamental stock and therefore would be traded only in a long position.
WRB daily - is in a nice and big symmetrical triangle after leg up which is very bullish. Volume is lower which indicates there is no seller at the moment and the price consolidates at that level which i

See all ideas
Summarizing what the indicators are suggesting.
Neutral
SellBuy
Strong sellStrong buy
Strong sellSellNeutralBuyStrong buy
Neutral
SellBuy
Strong sellStrong buy
Strong sellSellNeutralBuyStrong buy
Neutral
SellBuy
Strong sellStrong buy
Strong sellSellNeutralBuyStrong buy
An aggregate view of professional's ratings.
Neutral
SellBuy
Strong sellStrong buy
Strong sellSellNeutralBuyStrong buy
Neutral
SellBuy
Strong sellStrong buy
Strong sellSellNeutralBuyStrong buy
Neutral
SellBuy
Strong sellStrong buy
Strong sellSellNeutralBuyStrong buy
Displays a symbol's price movements over previous years to identify recurring trends.
WRB5255550
W. R. Berkley Corporation 3.15% 30-SEP-2061Yield to maturity
6.92%
Maturity date
Sep 30, 2061
WRB5146533
W. R. Berkley Corporation 3.55% 30-MAR-2052Yield to maturity
6.91%
Maturity date
Mar 30, 2052
WRB4984507
W. R. Berkley Corporation 4.0% 12-MAY-2050Yield to maturity
6.63%
Maturity date
May 12, 2050
WRB4150578
W. R. Berkley Corporation 4.75% 01-AUG-2044Yield to maturity
6.24%
Maturity date
Aug 1, 2044
WRB.AF
W. R. Berkley Corporation 6.25% 15-FEB-2037Yield to maturity
5.33%
Maturity date
Feb 15, 2037
See all 0HMZ bonds
Curated watchlists where 0HMZ is featured.

Frequently Asked Questions
The current price of 0HMZ is 68.8 USD — it has decreased by −0.72% in the past 24 hours. Watch BERKLEY(W.R.)CORP COM STK USD0.20 stock price performance more closely on the chart.
Depending on the exchange, the stock ticker may vary. For instance, on LSE exchange BERKLEY(W.R.)CORP COM STK USD0.20 stocks are traded under the ticker 0HMZ.
0HMZ stock has risen by 0.39% compared to the previous week, the month change is a −4.71% fall, over the last year BERKLEY(W.R.)CORP COM STK USD0.20 has showed a 23.78% increase.
We've gathered analysts' opinions on BERKLEY(W.R.)CORP COM STK USD0.20 future price: according to them, 0HMZ price has a max estimate of 86.00 USD and a min estimate of 64.00 USD. Watch 0HMZ chart and read a more detailed BERKLEY(W.R.)CORP COM STK USD0.20 stock forecast: see what analysts think of BERKLEY(W.R.)CORP COM STK USD0.20 and suggest that you do with its stocks.
0HMZ reached its all-time high on Mar 28, 2025 with the price of 76.2 USD, and its all-time low was 16.8 USD and was reached on Jan 18, 2018. View more price dynamics on 0HMZ chart.
See other stocks reaching their highest and lowest prices.
See other stocks reaching their highest and lowest prices.
0HMZ stock is 0.86% volatile and has beta coefficient of 0.36. Track BERKLEY(W.R.)CORP COM STK USD0.20 stock price on the chart and check out the list of the most volatile stocks — is BERKLEY(W.R.)CORP COM STK USD0.20 there?
Today BERKLEY(W.R.)CORP COM STK USD0.20 has the market capitalization of 26.27 B, it has decreased by −1.71% over the last week.
Yes, you can track BERKLEY(W.R.)CORP COM STK USD0.20 financials in yearly and quarterly reports right on TradingView.
BERKLEY(W.R.)CORP COM STK USD0.20 is going to release the next earnings report on Oct 27, 2025. Keep track of upcoming events with our Earnings Calendar.
0HMZ earnings for the last quarter are 1.05 USD per share, whereas the estimation was 1.03 USD resulting in a 2.27% surprise. The estimated earnings for the next quarter are 1.04 USD per share. See more details about BERKLEY(W.R.)CORP COM STK USD0.20 earnings.
BERKLEY(W.R.)CORP COM STK USD0.20 revenue for the last quarter amounts to 3.10 B USD, despite the estimated figure of 3.10 B USD. In the next quarter, revenue is expected to reach 3.17 B USD.
0HMZ net income for the last quarter is 401.29 M USD, while the quarter before that showed 417.57 M USD of net income which accounts for −3.90% change. Track more BERKLEY(W.R.)CORP COM STK USD0.20 financial stats to get the full picture.
Yes, 0HMZ dividends are paid quarterly. The last dividend per share was 0.59 USD. As of today, Dividend Yield (TTM)% is 0.48%. Tracking BERKLEY(W.R.)CORP COM STK USD0.20 dividends might help you take more informed decisions.
BERKLEY(W.R.)CORP COM STK USD0.20 dividend yield was 0.54% in 2024, and payout ratio reached 7.19%. The year before the numbers were 0.61% and 8.51% correspondingly. See high-dividend stocks and find more opportunities for your portfolio.
As of Aug 3, 2025, the company has 8.61 K employees. See our rating of the largest employees — is BERKLEY(W.R.)CORP COM STK USD0.20 on this list?
Like other stocks, 0HMZ shares are traded on stock exchanges, e.g. Nasdaq, Nyse, Euronext, and the easiest way to buy them is through an online stock broker. To do this, you need to open an account and follow a broker's procedures, then start trading. You can trade BERKLEY(W.R.)CORP COM STK USD0.20 stock right from TradingView charts — choose your broker and connect to your account.
Investing in stocks requires a comprehensive research: you should carefully study all the available data, e.g. company's financials, related news, and its technical analysis. So BERKLEY(W.R.)CORP COM STK USD0.20 technincal analysis shows the sell today, and its 1 week rating is buy. Since market conditions are prone to changes, it's worth looking a bit further into the future — according to the 1 month rating BERKLEY(W.R.)CORP COM STK USD0.20 stock shows the buy signal. See more of BERKLEY(W.R.)CORP COM STK USD0.20 technicals for a more comprehensive analysis.
If you're still not sure, try looking for inspiration in our curated watchlists.
If you're still not sure, try looking for inspiration in our curated watchlists.