Litecoin Is Forming A Bullish PatternLitecoin with ticker LTCUSD made nice and clean five-wave recovery back to 100 area in the 4-hour chart, which confirms support in place and bullish reversal, so it can be a higher degree wave (1), thus more upside is expected for a higher degree wave (3) after current complex W-X-Y correction in wave (2) that can be in final stages. First support is here around 90-85 area, while second deeper one would be at 80 area.
LTCUSD trade ideas

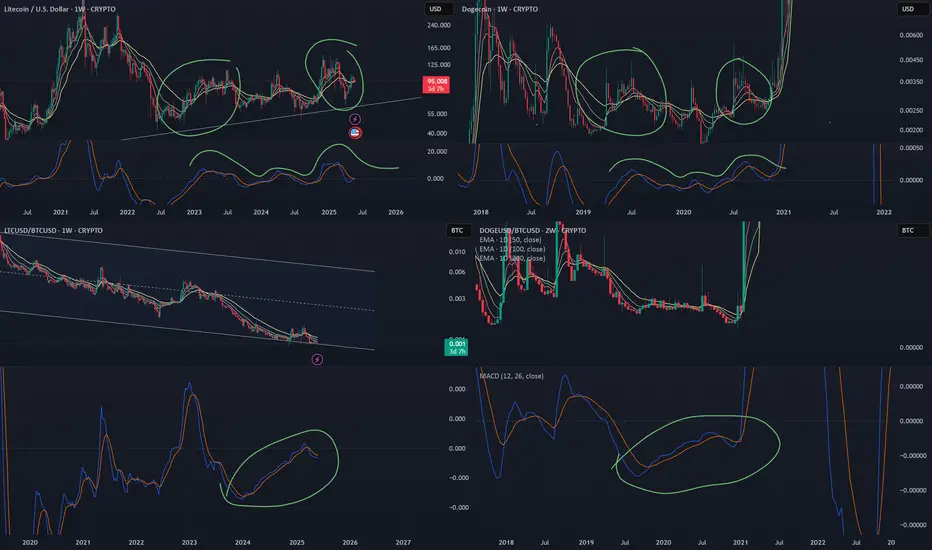
The return of the Dinosaurs. LTC is the new DOGE/XRPLooking back in 2020, you would say XRP will do 1000x as in 2017 - you would be wrong. Dumb money is now in DOGE, as they think it will do another 1000x as in 2021, which they would be also wrong.
LTC, ETH, ETC, Uniswap, Dot, Phala Network, Ocean Protocol is where real pumps could happen.
LTC - the path to 1k$The path to 1k$/ltc … when btc.d collapses wave 5th will overextend reaching the 2.6 and sometimes the 3.2 fob extension.
Even in normal conditions it could ez go to the 2.2 fib.

LTC back to ATHAfter 4 years of accumulation period, LTC is finally breaking up the long-term resistance since May 2021 when it reached ATH.
It looks like we are finally ready to take off.

LTCUSD INTRADAY uptrend continuation supported at 930Trend Overview:
Litecoin (LTC/USD) maintains a bullish structure, supported by an ongoing rising trend. The recent intraday price action suggests a corrective pullback, which may provide an opportunity for trend continuation if key support levels hold.
Key Technical Levels:
Support: 930 (primary), followed by 900 and 874
Resistance: 1,040 (initial), then 1,090 and 1,120
Technical Outlook:
A pullback to the 930 level, which aligns with a prior consolidation area, may present a bullish setup. A confirmed bounce from this support could initiate the next leg higher, with upside targets at 1,040, 1,090, and 1,120 over the longer term.
On the downside, a daily close below 930 would invalidate the bullish outlook, opening the door for a deeper retracement toward 900 and possibly 874.
Conclusion:
LTC/USD remains bullish above the 930 support level. A successful retest of this level could trigger continuation toward the 1,100+ range. However, a break below 930 would turn the short-term outlook bearish, signaling potential for deeper downside extension.
This communication is for informational purposes only and should not be viewed as any form of recommendation as to a particular course of action or as investment advice. It is not intended as an offer or solicitation for the purchase or sale of any financial instrument or as an official confirmation of any transaction. Opinions, estimates and assumptions expressed herein are made as of the date of this communication and are subject to change without notice. This communication has been prepared based upon information, including market prices, data and other information, believed to be reliable; however, Trade Nation does not warrant its completeness or accuracy. All market prices and market data contained in or attached to this communication are indicative and subject to change without notice.

LTC 4h LTC 4h chart ETS BBands are staring to get tight, if price starts from the low + plus the D chart bull flag, this will be a long.

LTCUSDTAs per the analysis the trend is down and there is a break of structure, the price should move down, with reward of 1:3.

LTC/USD – Litecoin Bulls Eye Key Reversal from Demand Zone! Litecoin recently dipped into a high-probability demand zone, and we’re already seeing bullish reaction candles form. With USD volatility expected this week, this zone could serve as a springboard for a short-term rally.
---
📊 Strategy Breakdown:
✅ Bullish Scenario:
Entry from $84.50–$86.50 zone
Target 1: $91.28 (mid-range liquidity sweep)
Target 2: $98.04 (major supply zone)
Stop loss: Below $84
🔻 Bearish Scenario:
If price breaks and closes below $84.30 with volume, the demand zone is invalidated—expect a drop toward $82.
---
⚡ Volume Profile Insight:
High volume nodes are clustered right inside the current orange demand block, suggesting institutional interest and possible accumulation. If price consolidates above $86, momentum could shift fast.
---
📢 What Traders Should Watch:
🕒 1H and 4H bullish confirmations
📅 Macro event triggers (USD news on June 3–4)
💰 Liquidity grabs near $91 before a bigger move
---
💬 Your Thoughts?
Do you think LTC can reclaim $91 and push for $98?
Or are we heading for a breakdown and new lows?
👇 Drop your ideas, charts, or setups in the comments!
✅ Like, Share, and Follow @FrankFx14 for more real-time crypto zone analysis and trade setups!
---
#Litecoin #LTC #CryptoSignals #LuxAlgo #PriceAction #CryptoTrading #TradingView #BuyTheDip #Scalping #SwingTrade #VolumeProfile

Litecoin Consolidation Nears End—New Downtrend Ahead?FenzoFx—Litecoin's consolidation near $91.0, marking 50% of its previous bearish leg, may be nearing its end as a long-wick bearish candlestick forms on the 4-hour chart.
Key support lies at $88.7, and a close below this level could trigger a downtrend targeting $87.00 and $86.00. The bearish outlook remains intact below $92.39 resistance.

LTC Eyes $97.88: Bullish Momentum HoldsFenzoFx—LTC/USD surged to $95.4 in the London session, stabilizing above Tokyo’s session high. Institutional traders increased long orders, signaling further upside potential. A bullish hammer at $93.5 confirms this critical support level. The expected target is $96.5, followed by $97.88 later this week.
The bullish trend holds unless LTC falls below $93.1, which would invalidate the outlook.


Litecoin channel breakout on the 12 hour?i'm new to this kinda but i'm studying hard and i'm making good money from a percentage standpoint. just building capital. anyway, yeah, i need help, but i'm not a complete dum dum. is this a good interpretation? any input would be great and if this is dumb just say it because i have very thick skin. loves...means...

LTCUSD has formed a head and shoulders bottomOn the daily chart, LTCUSD has formed a head and shoulders bottom pattern, and the short-term market is dominated by bulls. At present, attention can be paid to the resistance near 107.0. If it breaks through, it is expected to continue to rise, and the upper target is the previous supply area of 123.6-140.0.

LTCETH bottomingMany are very excited about ETH, but imo LTC will outperform ETH this cycle and get back to the top5 mcap coins.
LTCETH seems to make a roundign bottom here to get more upside.

LTC Approaching Key ResistanceFenzoFx—Litecoin (LTC) gained $2.0, reaching $96.9 and approaching weekly highs. During the London session, it is preparing for the next bullish move, with a potential test of $97.88 in New York to complete its range increase.
However, entering long at this level is risky in the short term. A retest of the FVG area ($94.0–$95.0) may occur in the late New York session before further gains.
As long as LTC holds above $93.1, the bullish trend remains intact, with $97.8 as the immediate target and $104.0 expected later this week.

Litecoin is Profit Taking at Critical Juncture FenzoFx—Litecoin's uptrend started at $92.34 and hit a weekly high of $102.5, tested by buyers in today's Tokyo session. This resistance may be retested in London or New York.
The selling push at $102.5 left a long-wick candlestick but lacked strong volume, indicating buyers are still active. Today's range is 76% of yesterday's move, supporting this outlook.
Bearish View : LTC/USD remains bearish below $103.0. We expect a retest at this level during the London session before declining toward $99.0.
Invalidation : If LTC/USD closes above $103.0, the bullish target shifts to $110.0.

Litecoin (LTC) Bullish Outlook – Targeting $120LTC is currently exhibiting strong bullish momentum after successfully breaking and closing above its previous lower high — a key structural shift indicating a potential trend reversal.
A major confirmation comes from the EMA crossover, which has historically acted as a powerful signal for LTC. In past cycles, LTC has shown high respect for EMA crossovers, both bullish and bearish. This time, the recent bullish EMA crossover is signaling sustained upward momentum.
On the fundamental side, Litecoin continues to hold a solid position in the crypto space with consistent development, a loyal community, and increasing adoption, especially due to its lower fees and faster transaction speeds compared to Bitcoin.
Given the strong technical structure, historical EMA behavior, and solid fundamentals, a move towards the $120 level seems not only likely but could be reached with relative ease if the current momentum sustains.

LTC - bull flag LTC (litecoin) breakout of the bull flag and getting on top of sma200D. Target 129 for long position.

Litecoin H4 | Falling toward an overlap supportLitecoin (LTCUSD) is falling towards an overlap support and could potentially bounce off this level to climb higher.
Buy entry is at 92.64 which is an overlap support.
Stop loss is at 86.50 which is a level that lies underneath a swing-low support and the 38.2% Fibonacci retracement.
Take profit is at 104.78 which is a swing-high resistance.
High Risk Investment Warning
Trading Forex/CFDs on margin carries a high level of risk and may not be suitable for all investors. Leverage can work against you.
Stratos Markets Limited (tradu.com/uk):
CFDs are complex instruments and come with a high risk of losing money rapidly due to leverage. 63% of retail investor accounts lose money when trading CFDs with this provider. You should consider whether you understand how CFDs work and whether you can afford to take the high risk of losing your money.
Stratos Europe Ltd (tradu.com/eu):
CFDs are complex instruments and come with a high risk of losing money rapidly due to leverage. 63% of retail investor accounts lose money when trading CFDs with this provider. You should consider whether you understand how CFDs work and whether you can afford to take the high risk of losing your money.
Stratos Global LLC (tradu.com/en):
Losses can exceed deposits.
Please be advised that the information presented on TradingView is provided to Tradu (‘Company’, ‘we’) by a third-party provider (‘TFA Global Pte Ltd’). Please be reminded that you are solely responsible for the trading decisions on your account. There is a very high degree of risk involved in trading. Any information and/or content is intended entirely for research, educational and informational purposes only and does not constitute investment or consultation advice or investment strategy. The information is not tailored to the investment needs of any specific person and therefore does not involve a consideration of any of the investment objectives, financial situation or needs of any viewer that may receive it. Kindly also note that past performance is not a reliable indicator of future results. Actual results may differ materially from those anticipated in forward-looking or past performance statements. We assume no liability as to the accuracy or completeness of any of the information and/or content provided herein and the Company cannot be held responsible for any omission, mistake nor for any loss or damage including without limitation to any loss of profit which may arise from reliance on any information supplied by TFA Global Pte Ltd.
The speaker(s) is neither an employee, agent nor representative of Tradu and is therefore acting independently. The opinions given are their own, constitute general market commentary, and do not constitute the opinion or advice of Tradu or any form of personal or investment advice. Tradu neither endorses nor guarantees offerings of third-party speakers, nor is Tradu responsible for the content, veracity or opinions of third-party speakers, presenters or participants.

LtcusdLitecoin is currently trading at $95.84, testing resistance near $97.22. A breakout above this level could target $100, while support is seen around $92.65. Monitoring key levels for potential opportunities.

Bull market scenario LITECOINAt this period, I'm speaking about LITECOIN, which currently has one of the strongest bull-looking charts on cryptocurrency!
We may see the price testing Fibo's higher levels very soon...
A bull market may begin, so I recommend focusing on higher price markings...
On another market, like BTC, Ethereum, or Pepe, we do not have vivid bull pictures.
That was one of the reasons for making this trading analysis...
Enjoy!


Bearish Pressure Eases—Can Litecoin Recover?FenzoFx—Litecoin remains bearish after breaking below $93.55, though selling pressure eased near $83.0. Currently, LTC/USD is testing the bearish Fair Value Gap at $87.5.
A recovery toward $93.55 is possible if price closes above the $88.0–$90.0 zone, allowing bullish momentum to extend toward $92.00.
However, a dip below $85.0 would invalidate this outlook, with the next bearish target at $81.0.
