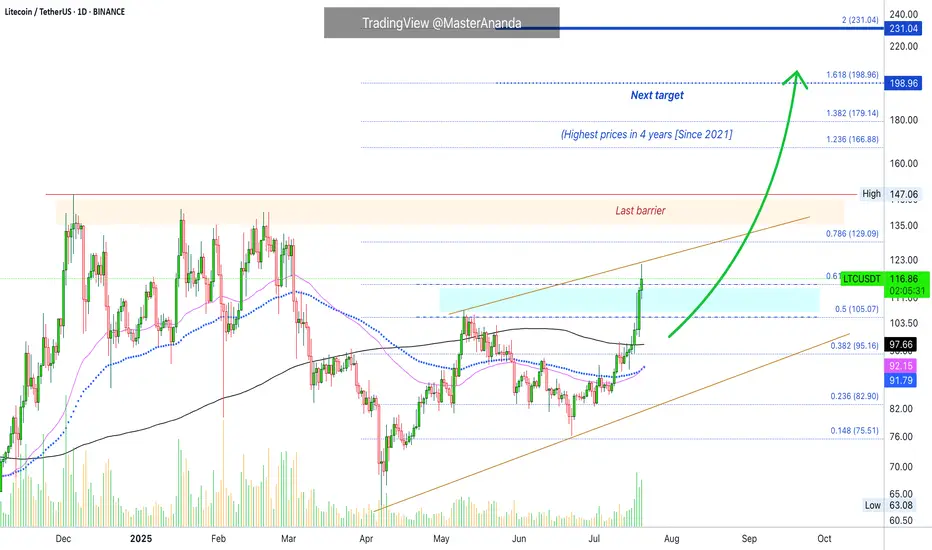
Litecoin Approaches $100 Support, Eyeing 17% Rally to $128Hello✌
Let’s analyze Litecoin’s upcoming price potential 📈.
BINANCE:LTCUSDT is approaching a solid daily support around the key psychological level of $100, which coincides with the 0.5 Fibonacci retracement. Holding this level could open the door for a 17 % upside, targeting $128 near a major
Related pairs

Litecoin (LTC): Still Bullish And Still Good For Long!Well, this video came out a little laggy, as markets were very volatile and had in the background the order book open, but overall we managed to make one TA for you.
We are bullish; it is still good for long as we are about to explode towards the local resistance line most likely—the $150 area.
M

Litecoin's Path Beyond $200 Revealed · Daily TimeframeWe looked at Litecoin on the weekly timeframe which is the long-term picture, but we also need to consider the daily to see what is happening up-close.
As soon as we open this chart we have three signals that stand out:
1) Litecoin is now trading above MA200 safely and rising. This is a very stron
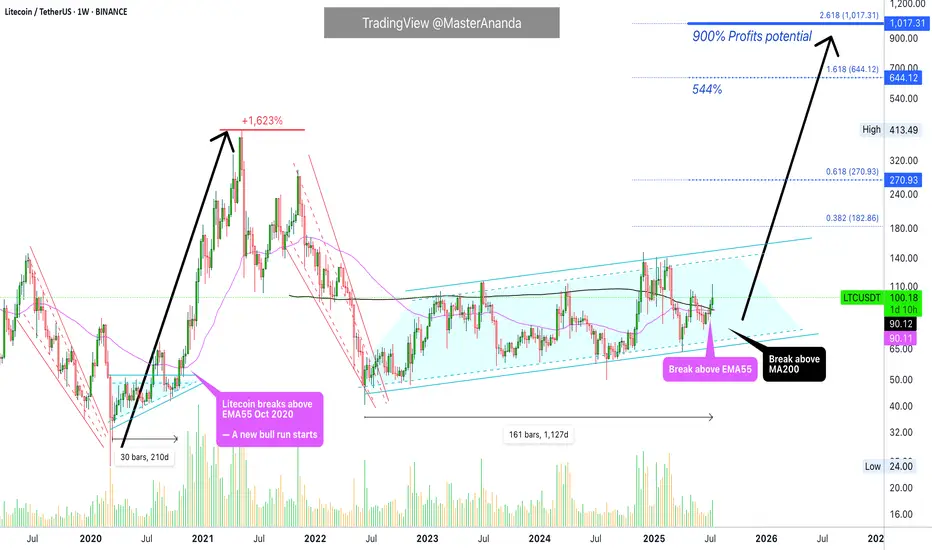
Litecoin $1,000 (900%) ExplainedBack in 2020, just 210 days of consolidation led to a 1,623% strong bull market. How much different market conditions we have now. Since 2022, Litecoin has been consolidating. The length of this consolidation is now 1,127 days. More than five times the previous consolidation and then some.
How muc
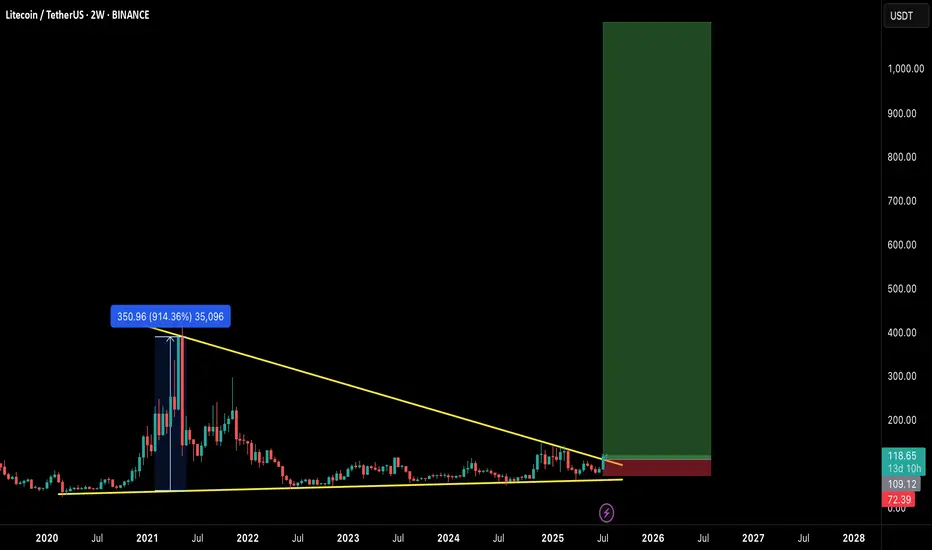
$LTC READY FOR EXPLOSION! THE COMEBACK OF THE OG?Litecoin has quietly formed one of the most massive macro structures in the market — a multi-year falling wedge on the 2-week timeframe, now breaking out with early confirmation.
This could be the start of a generational move, similar to the 2020 breakout. Let's break it down:
🧠 Technical Breakdow
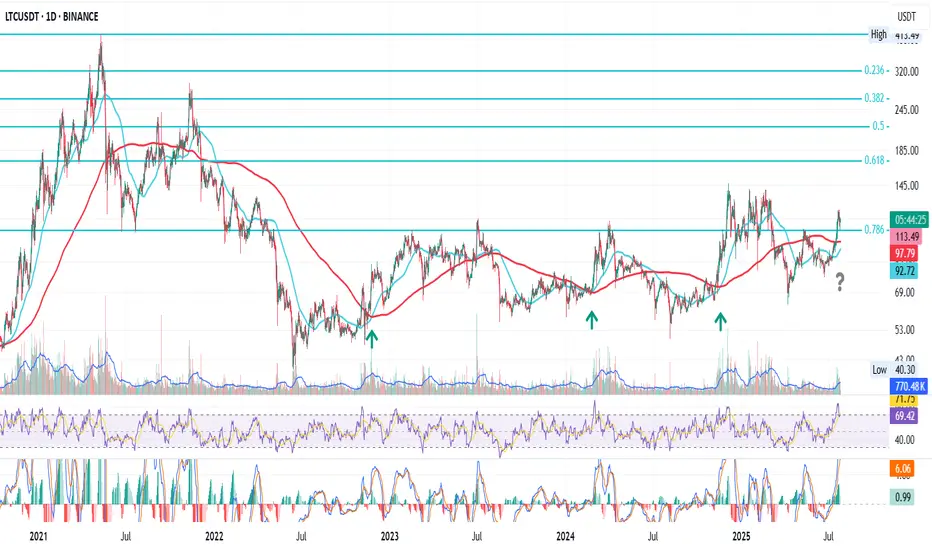
LTC Prepares to Break the CycleThis is LTC on the daily
After the bear market bottom in June 2022, LTC had three golden crosses, each followed by a rally into the 0.786 Fib level.
To be fair, last time price broke above that resistance, but got pushed back — like everything else — by the macro storms earlier this year.
Now we’
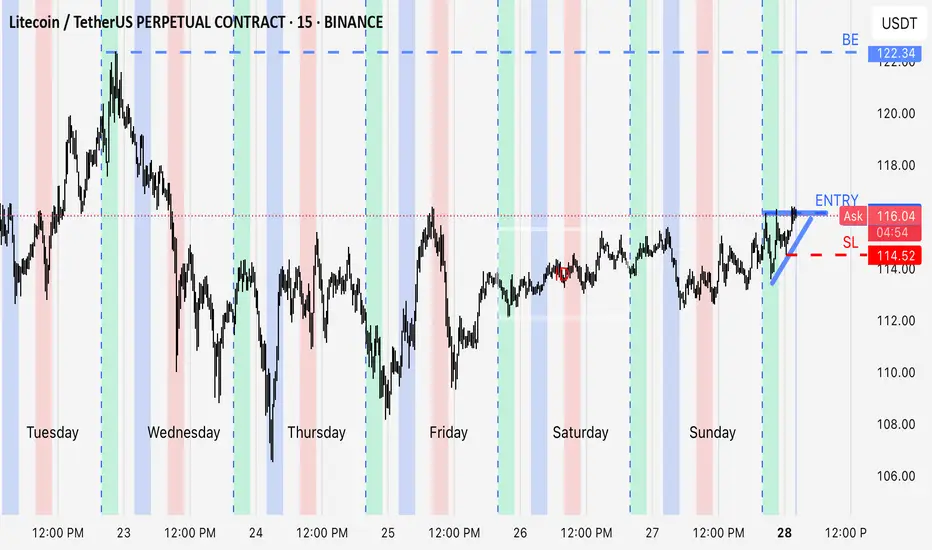
inside day breakoutLooking for a quick parabolic trade. Builded up from Asia and the gap time , supported by 20ma. On the daily it is bouncing of a 50% of a strong bullish move. This could be a really big R:R trade . Even 1:10 is possible. Looking to hold till close and breakeven if opportunity presents
LTCUSDT 4H CHART ANALYSIS.Structure: Market is in a bullish trend, forming higher highs and retracing after a strong impulse move.
Liquidity Sweep (SSL): Recent candles show a sweep of sell-side liquidity, targeting the lows near $108, clearing out weak longs.
FVG (Fair Value Gap): Price is approaching a 4H imbalance zone

#LTCUSDT: On The Way To $200, Get Ready For Swing Buy! Hey there!
Evening Everyone,
The price of this crypto is currently in a bullish formation, and it looks like it’s on the rise, potentially reaching $200. The best thing you can do is wait for the price to break out of the downtrend and then keep going up. You could set a target at $150 and then $2

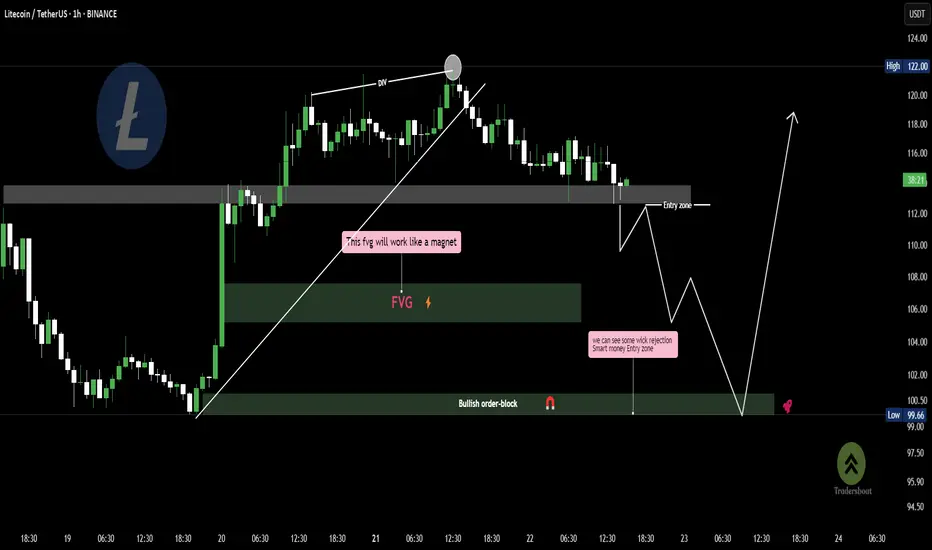
LTC Liquidity play loading.....Smart Money Awaits!🧠 Technical Breakdown:
Divergence signals exhaustion at the highs.
Price is likely to dip into the Fair Value Gap (FVG) — marked as a magnet zone for price attraction.
Expect wick rejections near the bullish order block — this is your smart money entry zone.
The projected move shows a possible li
See all ideas
Summarizing what the indicators are suggesting.
Oscillators
Neutral
SellBuy
Strong sellStrong buy
Strong sellSellNeutralBuyStrong buy
Oscillators
Neutral
SellBuy
Strong sellStrong buy
Strong sellSellNeutralBuyStrong buy
Summary
Neutral
SellBuy
Strong sellStrong buy
Strong sellSellNeutralBuyStrong buy
Summary
Neutral
SellBuy
Strong sellStrong buy
Strong sellSellNeutralBuyStrong buy
Summary
Neutral
SellBuy
Strong sellStrong buy
Strong sellSellNeutralBuyStrong buy
Moving Averages
Neutral
SellBuy
Strong sellStrong buy
Strong sellSellNeutralBuyStrong buy
Moving Averages
Neutral
SellBuy
Strong sellStrong buy
Strong sellSellNeutralBuyStrong buy
Displays a symbol's price movements over previous years to identify recurring trends.
Frequently Asked Questions
The current price of LiteCoin/Tether USD (LTC) is 110.2450 USDT — it has risen 1.12% in the past 24 hours. Try placing this info into the context by checking out what coins are also gaining and losing at the moment and seeing LTC price chart.
LiteCoin/Tether USD price has fallen by −4.49% over the last week, its month performance shows a 27.74% increase, and as for the last year, LiteCoin/Tether USD has increased by 55.06%. See more dynamics on LTC price chart.
Keep track of coins' changes with our Crypto Coins Heatmap.
Keep track of coins' changes with our Crypto Coins Heatmap.
LiteCoin/Tether USD (LTC) reached its highest price on May 10, 2021 — it amounted to 413.2800 USDT. Find more insights on the LTC price chart.
See the list of crypto gainers and choose what best fits your strategy.
See the list of crypto gainers and choose what best fits your strategy.
LiteCoin/Tether USD (LTC) reached the lowest price of 20.0200 USDT on Nov 9, 2019. View more LiteCoin/Tether USD dynamics on the price chart.
See the list of crypto losers to find unexpected opportunities.
See the list of crypto losers to find unexpected opportunities.
The safest choice when buying LTC is to go to a well-known crypto exchange. Some of the popular names are Binance, Coinbase, Kraken. But you'll have to find a reliable broker and create an account first. You can trade LTC right from TradingView charts — just choose a broker and connect to your account.
Crypto markets are famous for their volatility, so one should study all the available stats before adding crypto assets to their portfolio. Very often it's technical analysis that comes in handy. We prepared technical ratings for LiteCoin/Tether USD (LTC): today its technical analysis shows the buy signal, and according to the 1 week rating LTC shows the buy signal. And you'd better dig deeper and study 1 month rating too — it's strong buy. Find inspiration in LiteCoin/Tether USD trading ideas and keep track of what's moving crypto markets with our crypto news feed.
LiteCoin/Tether USD (LTC) is just as reliable as any other crypto asset — this corner of the world market is highly volatile. Today, for instance, LiteCoin/Tether USD is estimated as 2.88% volatile. The only thing it means is that you must prepare and examine all available information before making a decision. And if you're not sure about LiteCoin/Tether USD, you can find more inspiration in our curated watchlists.
You can discuss LiteCoin/Tether USD (LTC) with other users in our public chats, Minds or in the comments to Ideas.