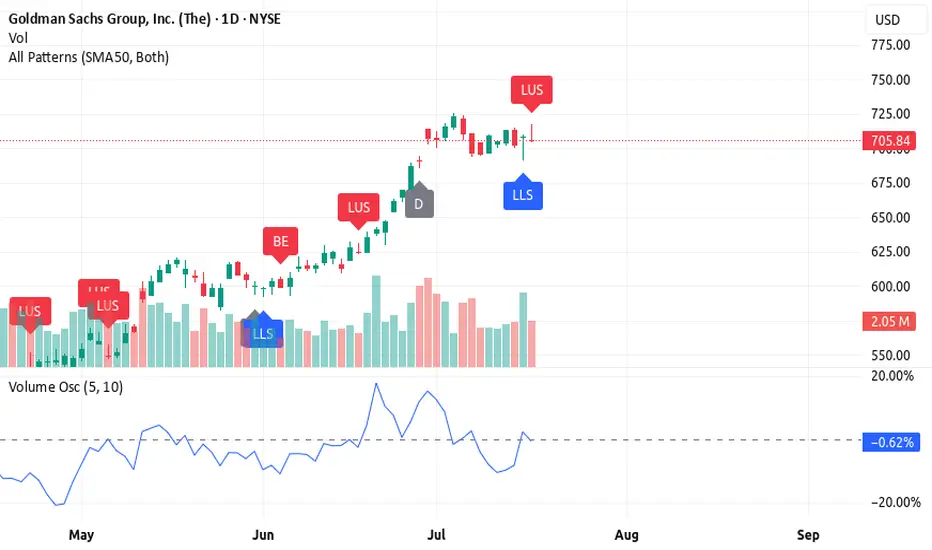
3 Reasons Why Goldman Sachs (GS) Still Looks Bullish🚀 3 Reasons Why Goldman Sachs (GS) Still Looks Bullish (Despite a Bearish Candle)
Goldman Sachs is in a bullish trend, but the latest candlestick is flashing a warning. Here's why GS still looks strong — and what to watch for next 📈
1️⃣ Candlestick pattern – long upper shadow
The long upper shado
Key facts today
Next report date
—
Report period
—
EPS estimate
—
Revenue estimate
—
39.1 EUR
13.79 B EUR
122.51 B EUR
301.07 M
About Goldman Sachs Group, Inc. (The)
Sector
Industry
CEO
David Michael Solomon
Website
Headquarters
New York
Founded
1869
FIGI
BBG01K3X5LZ8
The Goldman Sachs Group, Inc. engages in the provision of financial services. It operates through the following business segments: Global Banking and Markets, Asset and Wealth Management, and Platform Solutions. The Global Banking and Markets segment includes investment banking, global investments, and equity and debt investments. The Asset and Wealth Management segment relates to the direct-to-consumer banking business which includes lending, deposit-taking, and investing. The Platform Solutions segment includes consumer platforms such as partnerships offering credit cards and point-of-sale financing, and transaction banking. The company was founded by Marcus Goldman in 1869 and is headquartered in New York, NY.
Related stocks
GS SELL overbought GS and JPM are both overbought here. This market is a bubble like we've never seen the valuations are pie in the sky. Id sell calls here as we'll have a correction on these two names in the next couple of weeks. GS 4 hour chart is a screaming SELL

The Return Of The 3 Step Rocket Booster StrategyOne thing you can know about me is i desire to learn how to
drive a car.I still dont know how to drive car.
Sometimes i feel safe being driven
on public roads.
But the freedom that comes from owning your own car,
i still dont know how that feels like.
Whats better to do it yourself, or have other

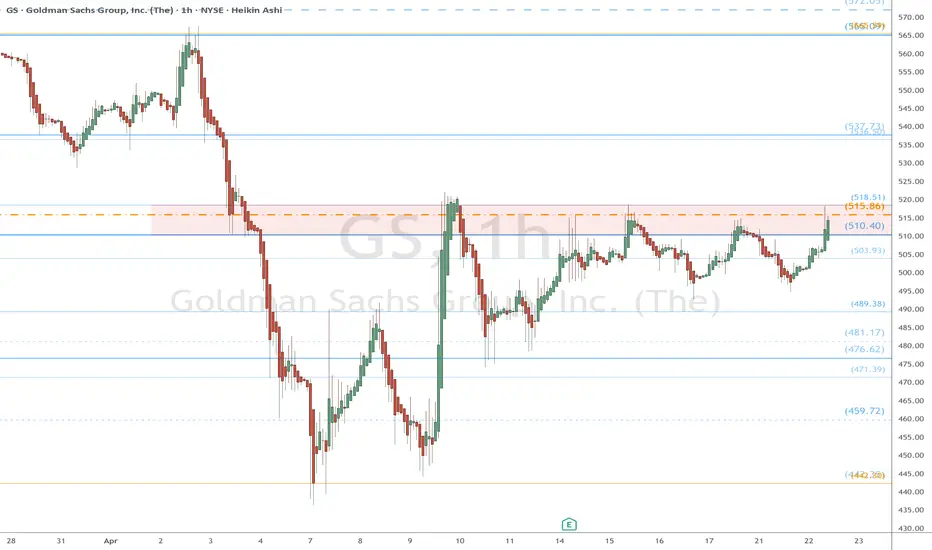
GS watch $515-518: Minor but key Resistance to determine trend GS and all banks trying to recover their pre-tariff strength.
Currently testing a well proven resistance at $515.86-518.51
Looking for a Rejection or Break-n-Retest of zone for entries.
Goldman Sachs (GS): Long Position Opportunity Amid Stabilizing V
-Key Insights: Goldman Sachs (GS) stands to benefit from stabilizing market
volatility, as reflected by the declining VIX. While macroeconomic uncertainties
and earnings season pressures persist, GS has room for recovery with strong
potential upside driven by resilience in financial services and li

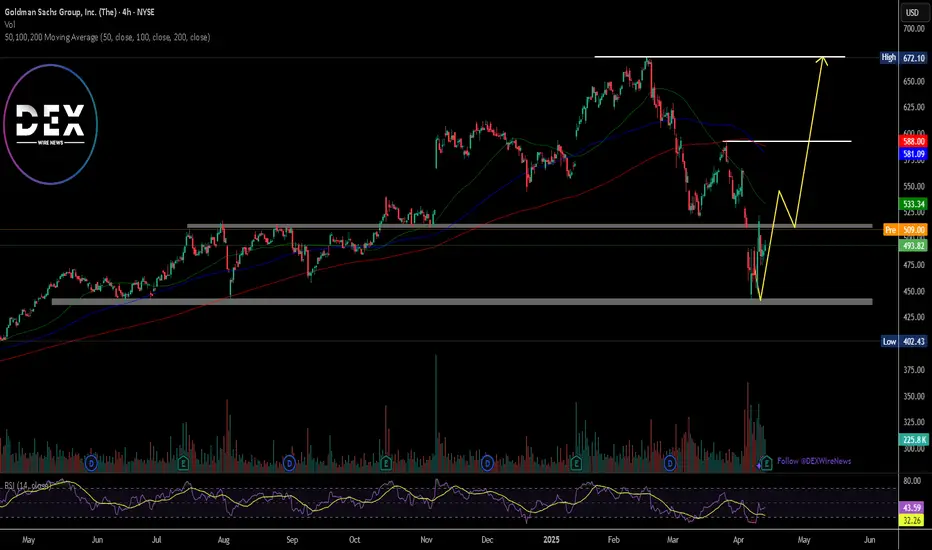
4/14/25 - $gs - A buy4/14/25 :: VROCKSTAR :: NYSE:GS
A buy
- 1.5x book w/ mid teens ROEs.
- 11x PE
- great result
- financials will do well in this environment
- not a tariff punching bag
- all the financial services should supplement IPO/ IB issues in the ST
- trying to keep cash high
- but you could get 3% yield on

Just In: The Goldman Sachs Group, Inc. (GS) Set for Breakout The Goldman Sachs Group, Inc. (GS) shares is set for a breakout today as the firm smashes Q1 Estimates leading to a 2.45% surge in Monday's premarket trading.
Reports Overview
Goldman Sachs delivered a strong first-quarter performance, beating Wall Street expectations on both earnings and revenue,
"Trip of Sache Sellers Crab" is still ongoing.Alright folks, let's talk Goldman Sachs.
They're dropping their earnings report tomorrow, which means Wall Street's gonna be buzzing like a caffeinated hive. Are we ready for a bullish breakout? A bearish beatdown? Honestly, your guess is as good as mine.I’m about as fundamentally clueless as a go

Goldman Sachs Raises Recession Odds to 35% Amid Tariff Fears Goldman Sachs (NYSE: GS) has lowered its S&P 500 year-end target again. The firm now sees the index ending at 5,700 points, down from its earlier forecast of 6,200. This revision comes just days before President Trump’s new round of tariffs is set to begin. The updated target implies only a 2% gain

Goldman Sachs Earnings Tomorrow – Ready for a Bullish Breakout?Goldman Sachs (NYSE: GS) is shaping up for a potential bullish move ahead of its earnings report tomorrow (January 15) before the market opens. With the stock bouncing off key support levels and positive momentum indicators, a strong earnings surprise could trigger further upside toward my targets.

See all ideas
Summarizing what the indicators are suggesting.
Neutral
SellBuy
Strong sellStrong buy
Strong sellSellNeutralBuyStrong buy
Neutral
SellBuy
Strong sellStrong buy
Strong sellSellNeutralBuyStrong buy
Neutral
SellBuy
Strong sellStrong buy
Strong sellSellNeutralBuyStrong buy
An aggregate view of professional's ratings.
Neutral
SellBuy
Strong sellStrong buy
Strong sellSellNeutralBuyStrong buy
Neutral
SellBuy
Strong sellStrong buy
Strong sellSellNeutralBuyStrong buy
Neutral
SellBuy
Strong sellStrong buy
Strong sellSellNeutralBuyStrong buy
Displays a symbol's price movements over previous years to identify recurring trends.
Curated watchlists where 1GS is featured.


Frequently Asked Questions
The current price of 1GS is 633.7 EUR — it has increased by 2.66% in the past 24 hours. Watch GOLDMAN SACHS GROUP stock price performance more closely on the chart.
Depending on the exchange, the stock ticker may vary. For instance, on MIL exchange GOLDMAN SACHS GROUP stocks are traded under the ticker 1GS.
1GS stock has risen by 3.14% compared to the previous week, the month change is a 5.81% rise, over the last year GOLDMAN SACHS GROUP has showed a 41.89% increase.
We've gathered analysts' opinions on GOLDMAN SACHS GROUP future price: according to them, 1GS price has a max estimate of 713.15 EUR and a min estimate of 522.40 EUR. Watch 1GS chart and read a more detailed GOLDMAN SACHS GROUP stock forecast: see what analysts think of GOLDMAN SACHS GROUP and suggest that you do with its stocks.
1GS stock is 0.84% volatile and has beta coefficient of 0.17. Track GOLDMAN SACHS GROUP stock price on the chart and check out the list of the most volatile stocks — is GOLDMAN SACHS GROUP there?
Today GOLDMAN SACHS GROUP has the market capitalization of 192.80 B, it has increased by 0.73% over the last week.
Yes, you can track GOLDMAN SACHS GROUP financials in yearly and quarterly reports right on TradingView.
GOLDMAN SACHS GROUP is going to release the next earnings report on Oct 14, 2025. Keep track of upcoming events with our Earnings Calendar.
1GS earnings for the last quarter are 9.26 EUR per share, whereas the estimation was 8.19 EUR resulting in a 13.02% surprise. The estimated earnings for the next quarter are 9.00 EUR per share. See more details about GOLDMAN SACHS GROUP earnings.
GOLDMAN SACHS GROUP revenue for the last quarter amounts to 12.38 B EUR, despite the estimated figure of 11.46 B EUR. In the next quarter, revenue is expected to reach 11.73 B EUR.
1GS net income for the last quarter is 3.16 B EUR, while the quarter before that showed 4.38 B EUR of net income which accounts for −27.84% change. Track more GOLDMAN SACHS GROUP financial stats to get the full picture.
Yes, 1GS dividends are paid quarterly. The last dividend per share was 2.64 EUR. As of today, Dividend Yield (TTM)% is 1.61%. Tracking GOLDMAN SACHS GROUP dividends might help you take more informed decisions.
GOLDMAN SACHS GROUP dividend yield was 2.01% in 2024, and payout ratio reached 28.37%. The year before the numbers were 2.72% and 45.92% correspondingly. See high-dividend stocks and find more opportunities for your portfolio.
As of Aug 13, 2025, the company has 46.5 K employees. See our rating of the largest employees — is GOLDMAN SACHS GROUP on this list?
Like other stocks, 1GS shares are traded on stock exchanges, e.g. Nasdaq, Nyse, Euronext, and the easiest way to buy them is through an online stock broker. To do this, you need to open an account and follow a broker's procedures, then start trading. You can trade GOLDMAN SACHS GROUP stock right from TradingView charts — choose your broker and connect to your account.
Investing in stocks requires a comprehensive research: you should carefully study all the available data, e.g. company's financials, related news, and its technical analysis. So GOLDMAN SACHS GROUP technincal analysis shows the buy rating today, and its 1 week rating is strong buy. Since market conditions are prone to changes, it's worth looking a bit further into the future — according to the 1 month rating GOLDMAN SACHS GROUP stock shows the buy signal. See more of GOLDMAN SACHS GROUP technicals for a more comprehensive analysis.
If you're still not sure, try looking for inspiration in our curated watchlists.
If you're still not sure, try looking for inspiration in our curated watchlists.