JNJ - Macro View 🌐Hello TradingView Family / Fellow Traders. This is Richard, also known as theSignalyst.
📈 JNJ has exhibited an overall bullish trend, trading within the ascending wedge pattern outlined in blue. It is presently nearing the lower boundary/blue trendline.
At present, JNJ is undergoing a correction p
Key facts today
Next report date
—
Report period
—
EPS estimate
—
Revenue estimate
—
8.38 EUR
13.59 B EUR
85.80 B EUR
2.40 B
About Johnson & Johnson
Sector
Industry
CEO
Joaquin Duato
Website
Headquarters
New Brunswick
Founded
1887
FIGI
BBG01K3XQNH1
Johnson & Johnson is a holding company, which engages in the research, development, manufacture, and sale of products in the healthcare field. It operates through the Innovative Medicine and MedTech segments. The Innovative Medicine segment focuses on immunology, infectious diseases, neuroscience, oncology, cardiovascular and metabolism, and pulmonary hypertension. The MedTech segment includes a portfolio of products used in the interventional solutions, orthopaedics, surgery, and vision categories. The company was founded by Robert Wood Johnson I, James Wood Johnson, and Edward Mead Johnson Sr. in 1887 and is headquartered in New Brunswick, NJ.

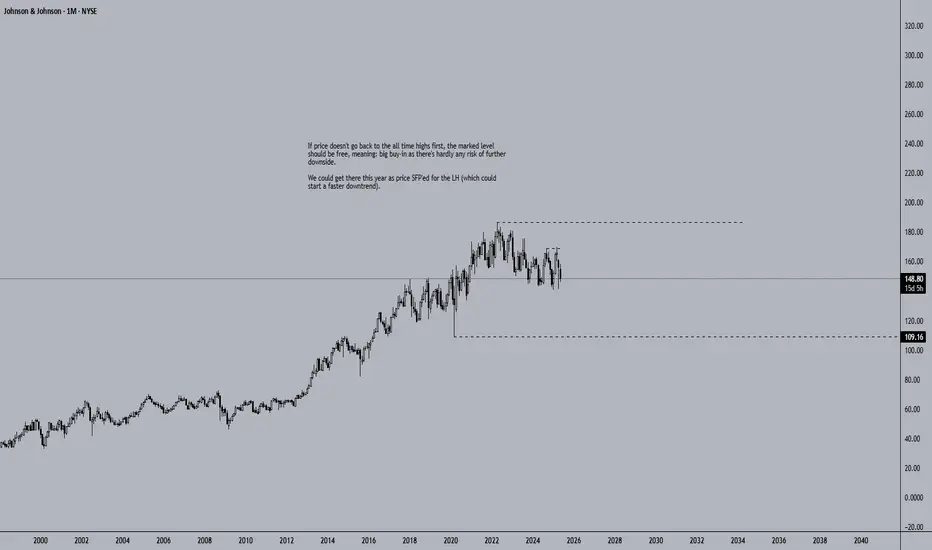
Johnson & Johnson Could Be FreeIf price doesn't go back to the all time highs first, the marked level should be free, meaning: big buy-in as there's hardly any risk of further downside.
We could get there this year as price SFP'ed for the LH (which could start a faster downtrend).
JNJ - Where are you heading Johnson?Good Morning,
Hope all is well. Chart explains it all. Still in a downtrend JNJ is fighting. Looks like we have some momentum forming, lets see how strong it is. Failure to break EMA/Resistance would be bearish, otherwise a break would be bullish.
Enjoy!

JNJ - 2 scenariosHi traders,
JNJ is currently consolidating inside a symmetrical triangle.
We can expect two scenarios:
Bullish scenario:
Open a long position if the price breaks the downsloping resistance line.
SL: below $153.50
Potential TP: $164
Bearish scenario:
Open a short position if the price breaks down a

JOHNSON AND JOHNSON: Re-accumulation is targeting $175.JNJ is neutral on its 1D technical outlook (RSI = 49.991, MACD = -1.040, ADX = 18.184) as it's only trading around its 1W MA50 but having made an impressive rebound 4 weeks ago inside the Demand Zone. This is the 4th time this Demand Zone provided a rally and the last one even crossed over the 3 yea

JNJ watch $156.72-158.17: Double Golden zone to determine TrendJNJ consolidating around a major zone defined by dual Goldens.
Key is Golden Genesis at $156.72, and Golden Covid at $158.17
This is an important zone that everyone is now keenly aware of.

Long and LongerMomentum demonstrated in the recent chart is significant enough to break out of anything sideways.
Potential for an increase to a $200 JNJ is not unreasonable.

Buy JNJ for Stable Gains Amid Earnings Optimism Next Week
- Key Insights: Johnson & Johnson demonstrated robust earnings performance with
an EPS of $2.77, surpassing consensus estimates and reinforcing its
defensive stock status. Its diverse portfolio and consistent ability to
execute in volatile markets make it a strong candidate for growth-oriente

Johnson & Johnson Wave Analysis – 18 April 2025
- Johnson & Johnson rising inside weekly price range
- Likely to test resistance level 165.60
Johnson & Johnson continues to rise in the primary upward impulse wave 3, which started earlier from the major support level 145.00 (lower border of the weekly sideways price range from 2023).
The up

Johnson & Johnson Beats Q1 Estimates, Premarket Not Doing WellJohnson & Johnson (NYSE: NYSE:JNJ ) on Tuesday reported better-than-expected Q1 results and lifted its sales forecast for the full year.
Johnson & Johnson (NYSE: NYSE:JNJ ), together with its subsidiaries, engages in the research and development, manufacture, and sale of various products in the h
See all ideas
Summarizing what the indicators are suggesting.
Neutral
SellBuy
Strong sellStrong buy
Strong sellSellNeutralBuyStrong buy
Neutral
SellBuy
Strong sellStrong buy
Strong sellSellNeutralBuyStrong buy
Neutral
SellBuy
Strong sellStrong buy
Strong sellSellNeutralBuyStrong buy
An aggregate view of professional's ratings.
Neutral
SellBuy
Strong sellStrong buy
Strong sellSellNeutralBuyStrong buy
Neutral
SellBuy
Strong sellStrong buy
Strong sellSellNeutralBuyStrong buy
Neutral
SellBuy
Strong sellStrong buy
Strong sellSellNeutralBuyStrong buy
Displays a symbol's price movements over previous years to identify recurring trends.
US478160CT9
JOHNSON&JOHN 20/60Yield to maturity
7.09%
Maturity date
Sep 1, 2060
US478160CS1
JOHNSON&JOHN 20/50Yield to maturity
6.92%
Maturity date
Sep 1, 2050
US478160CR3
JOHNSON&JOHN 20/40Yield to maturity
6.35%
Maturity date
Sep 1, 2040
US478160CM4
JOHNSON & JOHNSON 17/48Yield to maturity
6.11%
Maturity date
Jan 15, 2048
US478160BV5
JOHNSON & JOHNSON 16/46Yield to maturity
5.93%
Maturity date
Mar 1, 2046
JNJJ
JOHNSON & JOHNSON 17/47Yield to maturity
5.93%
Maturity date
Mar 3, 2047
US478160CL6
JOHNSON & JOHNSON 17/38Yield to maturity
5.47%
Maturity date
Jan 15, 2038
US478160CX0
JOHNSON&JOHN 24/54Yield to maturity
5.45%
Maturity date
Jun 1, 2054
JNJ4077469
Johnson & Johnson 4.5% 05-DEC-2043Yield to maturity
5.43%
Maturity date
Dec 5, 2043
US478160CF9
JOHNSON & JOHNSON 17/37Yield to maturity
5.34%
Maturity date
Mar 3, 2037
US478160BA1
JOHNSON & JOHNSON 11/41Yield to maturity
5.23%
Maturity date
May 15, 2041
See all 1JNJ bonds
Curated watchlists where 1JNJ is featured.


Related stocks
Frequently Asked Questions
The current price of 1JNJ is 134.70 EUR — it has decreased by −0.59% in the past 24 hours. Watch JOHNSON & JOHNSON stock price performance more closely on the chart.
Depending on the exchange, the stock ticker may vary. For instance, on MIL exchange JOHNSON & JOHNSON stocks are traded under the ticker 1JNJ.
1JNJ stock has fallen by −0.04% compared to the previous week, the month change is a −3.16% fall, over the last year JOHNSON & JOHNSON has showed a −1.68% decrease.
We've gathered analysts' opinions on JOHNSON & JOHNSON future price: according to them, 1JNJ price has a max estimate of 166.85 EUR and a min estimate of 137.99 EUR. Watch 1JNJ chart and read a more detailed JOHNSON & JOHNSON stock forecast: see what analysts think of JOHNSON & JOHNSON and suggest that you do with its stocks.
1JNJ reached its all-time high on Feb 28, 2025 with the price of 162.26 EUR, and its all-time low was 128.30 EUR and was reached on Apr 9, 2025. View more price dynamics on 1JNJ chart.
See other stocks reaching their highest and lowest prices.
See other stocks reaching their highest and lowest prices.
1JNJ stock is 1.24% volatile and has beta coefficient of 0.08. Track JOHNSON & JOHNSON stock price on the chart and check out the list of the most volatile stocks — is JOHNSON & JOHNSON there?
Today JOHNSON & JOHNSON has the market capitalization of 325.18 B, it has increased by 0.36% over the last week.
Yes, you can track JOHNSON & JOHNSON financials in yearly and quarterly reports right on TradingView.
JOHNSON & JOHNSON is going to release the next earnings report on Jul 16, 2025. Keep track of upcoming events with our Earnings Calendar.
1JNJ earnings for the last quarter are 2.56 EUR per share, whereas the estimation was 2.39 EUR resulting in a 7.33% surprise. The estimated earnings for the next quarter are 2.33 EUR per share. See more details about JOHNSON & JOHNSON earnings.
JOHNSON & JOHNSON revenue for the last quarter amounts to 20.24 B EUR, despite the estimated figure of 19.93 B EUR. In the next quarter, revenue is expected to reach 19.88 B EUR.
1JNJ net income for the last quarter is 10.17 B EUR, while the quarter before that showed 3.31 B EUR of net income which accounts for 206.76% change. Track more JOHNSON & JOHNSON financial stats to get the full picture.
Yes, 1JNJ dividends are paid quarterly. The last dividend per share was 1.15 EUR. As of today, Dividend Yield (TTM)% is 3.23%. Tracking JOHNSON & JOHNSON dividends might help you take more informed decisions.
JOHNSON & JOHNSON dividend yield was 3.40% in 2024, and payout ratio reached 84.80%. The year before the numbers were 3.00% and 84.93% correspondingly. See high-dividend stocks and find more opportunities for your portfolio.
As of Jun 12, 2025, the company has 138.1 K employees. See our rating of the largest employees — is JOHNSON & JOHNSON on this list?
EBITDA measures a company's operating performance, its growth signifies an improvement in the efficiency of a company. JOHNSON & JOHNSON EBITDA is 26.42 B EUR, and current EBITDA margin is 31.71%. See more stats in JOHNSON & JOHNSON financial statements.
Like other stocks, 1JNJ shares are traded on stock exchanges, e.g. Nasdaq, Nyse, Euronext, and the easiest way to buy them is through an online stock broker. To do this, you need to open an account and follow a broker's procedures, then start trading. You can trade JOHNSON & JOHNSON stock right from TradingView charts — choose your broker and connect to your account.
Investing in stocks requires a comprehensive research: you should carefully study all the available data, e.g. company's financials, related news, and its technical analysis. So JOHNSON & JOHNSON technincal analysis shows the sell today, and its 1 week rating is sell. Since market conditions are prone to changes, it's worth looking a bit further into the future — according to the 1 month rating JOHNSON & JOHNSON stock shows the strong sell signal. See more of JOHNSON & JOHNSON technicals for a more comprehensive analysis.
If you're still not sure, try looking for inspiration in our curated watchlists.
If you're still not sure, try looking for inspiration in our curated watchlists.