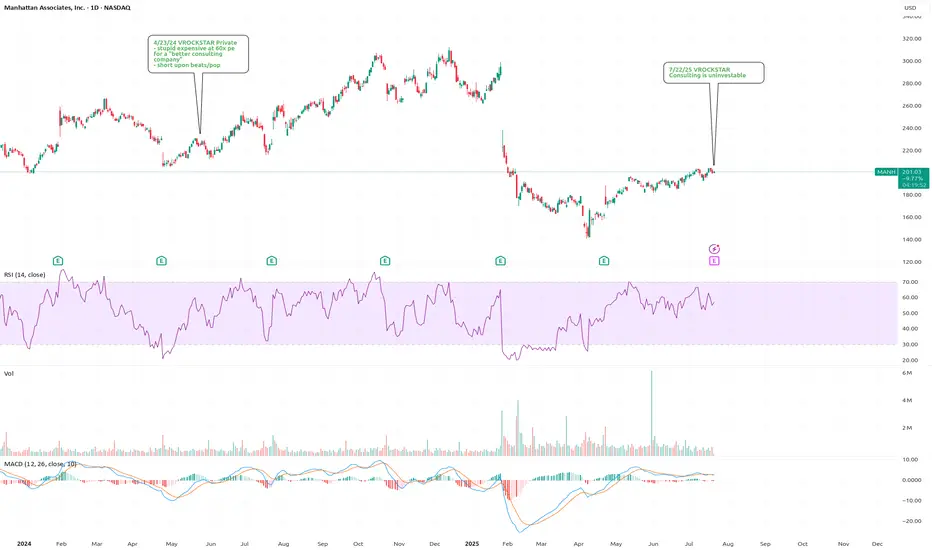
7/22/25 - $manh - Consulting is uninvestable 7/22/25 :: VROCKSTAR :: BOATS:MANH
Consulting is uninvestable
- AI will gut this useless industry. I can discern this from using enough AI tools long enough. not interested in your "but muh integration moat bs". it's fafo, prefer u don't have to fafo pnl
- so while it might not be a short here (
Next report date
—
Report period
—
EPS estimate
—
Revenue estimate
—
3 EUR
210.93 M EUR
1.01 B EUR
59.84 M
About Manhattan Associates, Inc.
Sector
Industry
CEO
Eric A. Clark
Website
Headquarters
Atlanta
Founded
1990
FIGI
BBG01TNX95W1
Manhattan Associates, Inc. engages in the business of developing, selling, deploying, servicing, and maintaining software solutions designed to manage supply chains, inventory, and omnichannel operations for retailers, wholesalers, manufacturers, logistics providers, and other organizations. It operates through the following geographical segments: North and Latin America, Europe, Middle East, and Africa, and Asia Pacific. The company was founded by Deepak Raghavan in October 1990 and is headquartered in Atlanta, GA.
Related stocks
Manhattan Associates stock Chart Fibonacci Analysis 050125Trading Idea
1) Find a FIBO slingshot
2) Check FIBO 61.80% level
3) Entry Point > 170/61.80%
Chart time frame: D
A) 15 min(1W-3M)
B) 1 hr(3M-6M)
C) 4 hr(6M-1year)
D) 1 day(1-3years)
Stock progress: A
A) Keep rising over 61.80% resistance
B) 61.80% resistance
C) 61.80% support
D) Hit the bottom

MANH to $244My trading plan is very simple.
I buy or sell when price tags the top or bottom of parallel channels.
I confirm when price hits Fibonacci levels.
So...
Here's why I'm picking this symbol to do the thing.
Price at bottom of channels (period 100 52 & 26)
Stochastic Momentum Index (SMI) at overs

Manhattan Associates (MANH)Asset Class: Stocks
Income Type: Daily
Symbol: MANH
Trade Type: Long
Trends:
Short Term: Down
Long Term: Up
Set-Up Parameters:
Entry: 273.88 (at the Breakout)
Stop: 260.94
TP 312.72 (3:1)
Trade idea:
A price pin into a daily demand zone formed by a rally-base-rally with Fair Value Gap , enter

MANH TL break possibleMANH supply line softie, coming into gap with down trendline break and 9/13 cross possibilty

4/23/24 - $MANH print4/23 - stupid expensive 60x pe and just a "better" consulting company but probably beats lazy estimates in a "good" tape and would be a good short upon 1) beat and 2) pop into the coming months. good luck longs... either use this as exit liquidity if you've done the work or realistically you should

MANHManhattan Associates Inc (Manhattan Associates) provides software solutions. The company develops, deploys, services and maintains software solutions that manage supply chain, inventory and omni-channel operations. Its solution offerings include software, services, and hardware.

#MANH $MANH Long#MANH NASDAQ:MANH
📈Chart Pattern: Cup & Handle
🫵Perspective: Long
💔Stop loss: Breaking $ 165
#MANH SKILLING:NASDAQ AMEX:SPY

MANH 3d Chart 2H 2022Tracking the Manhattan Associates price action with this idea.
Expecting it to revisit the 108-120 range over the next few months.

MANH Low Volume BreakoutMANH breakout happened
Volume is on a lower side, wanted to see a breakout with high volume
Price is consolidating near supply zone

See all ideas
Summarizing what the indicators are suggesting.
Neutral
SellBuy
Strong sellStrong buy
Strong sellSellNeutralBuyStrong buy
Neutral
SellBuy
Strong sellStrong buy
Strong sellSellNeutralBuyStrong buy
Neutral
SellBuy
Strong sellStrong buy
Strong sellSellNeutralBuyStrong buy
An aggregate view of professional's ratings.
Neutral
SellBuy
Strong sellStrong buy
Strong sellSellNeutralBuyStrong buy
Neutral
SellBuy
Strong sellStrong buy
Strong sellSellNeutralBuyStrong buy
Neutral
SellBuy
Strong sellStrong buy
Strong sellSellNeutralBuyStrong buy
Frequently Asked Questions
The current price of 1MANH is 188 EUR — it has increased by 1.08% in the past 24 hours. Watch MANHATTAN ASSOCIATES INC stock price performance more closely on the chart.
Depending on the exchange, the stock ticker may vary. For instance, on MIL exchange MANHATTAN ASSOCIATES INC stocks are traded under the ticker 1MANH.
1MANH stock has risen by 8.67% compared to the previous week, the month change is a 13.25% rise, over the last year MANHATTAN ASSOCIATES INC has showed a 23.68% increase.
We've gathered analysts' opinions on MANHATTAN ASSOCIATES INC future price: according to them, 1MANH price has a max estimate of 212.44 EUR and a min estimate of 169.96 EUR. Watch 1MANH chart and read a more detailed MANHATTAN ASSOCIATES INC stock forecast: see what analysts think of MANHATTAN ASSOCIATES INC and suggest that you do with its stocks.
1MANH reached its all-time high on May 13, 2025 with the price of 176 EUR, and its all-time low was 152 EUR and was reached on Apr 25, 2025. View more price dynamics on 1MANH chart.
See other stocks reaching their highest and lowest prices.
See other stocks reaching their highest and lowest prices.
1MANH stock is 1.06% volatile and has beta coefficient of 1.39. Track MANHATTAN ASSOCIATES INC stock price on the chart and check out the list of the most volatile stocks — is MANHATTAN ASSOCIATES INC there?
Today MANHATTAN ASSOCIATES INC has the market capitalization of 11.25 B, it has increased by 0.69% over the last week.
Yes, you can track MANHATTAN ASSOCIATES INC financials in yearly and quarterly reports right on TradingView.
MANHATTAN ASSOCIATES INC is going to release the next earnings report on Oct 28, 2025. Keep track of upcoming events with our Earnings Calendar.
1MANH earnings for the last quarter are 1.11 EUR per share, whereas the estimation was 0.96 EUR resulting in a 16.24% surprise. The estimated earnings for the next quarter are 1.00 EUR per share. See more details about MANHATTAN ASSOCIATES INC earnings.
MANHATTAN ASSOCIATES INC revenue for the last quarter amounts to 231.26 M EUR, despite the estimated figure of 223.87 M EUR. In the next quarter, revenue is expected to reach 231.40 M EUR.
1MANH net income for the last quarter is 48.20 M EUR, while the quarter before that showed 48.60 M EUR of net income which accounts for −0.83% change. Track more MANHATTAN ASSOCIATES INC financial stats to get the full picture.
No, 1MANH doesn't pay any dividends to its shareholders. But don't worry, we've prepared a list of high-dividend stocks for you.
As of Jul 27, 2025, the company has 4.69 K employees. See our rating of the largest employees — is MANHATTAN ASSOCIATES INC on this list?
EBITDA measures a company's operating performance, its growth signifies an improvement in the efficiency of a company. MANHATTAN ASSOCIATES INC EBITDA is 239.49 M EUR, and current EBITDA margin is 25.70%. See more stats in MANHATTAN ASSOCIATES INC financial statements.
Like other stocks, 1MANH shares are traded on stock exchanges, e.g. Nasdaq, Nyse, Euronext, and the easiest way to buy them is through an online stock broker. To do this, you need to open an account and follow a broker's procedures, then start trading. You can trade MANHATTAN ASSOCIATES INC stock right from TradingView charts — choose your broker and connect to your account.