OMC could soar from here! 50% higher this year?Looking at the OMC chart on an extended timeframe, an obvious harmonic pattern jumps out. I think it could replay this year. 50% higher from here wouldn't be unprecedented.
Next report date
—
Report period
—
EPS estimate
—
Revenue estimate
—
6.84 EUR
1.43 B EUR
15.16 B EUR
192.74 M
About Omnicom Group Inc.
Sector
Industry
CEO
John D. Wren
Website
Headquarters
New York
Founded
1944
FIGI
BBG01TNY75H8
Omnicom Group, Inc. is a holding company, which provides advertising, marketing and corporate communications services. The company was founded by Maxwell Dane in 1944 and is headquartered in New York, NY.
Related stocks

$OMC with a bullish outlook following its earnings #StocksThe PEAD projected a bullish outlook for NYSE:OMC after a negative over reaction following its earnings release placing the stock in drift C with an expected accuracy of 42.86%.

Stocks pairs trading: IPG vs OMCComparing the financial metrics and market dynamics of Interpublic Group (IPG) and Omnicom Group Inc. (OMC) provides valuable insights for investors contemplating their investment choices.
Reasons to Consider Buying IPG Over Selling OMC:
Valuation and Growth Prospects: IPG's forward P/E of 10.

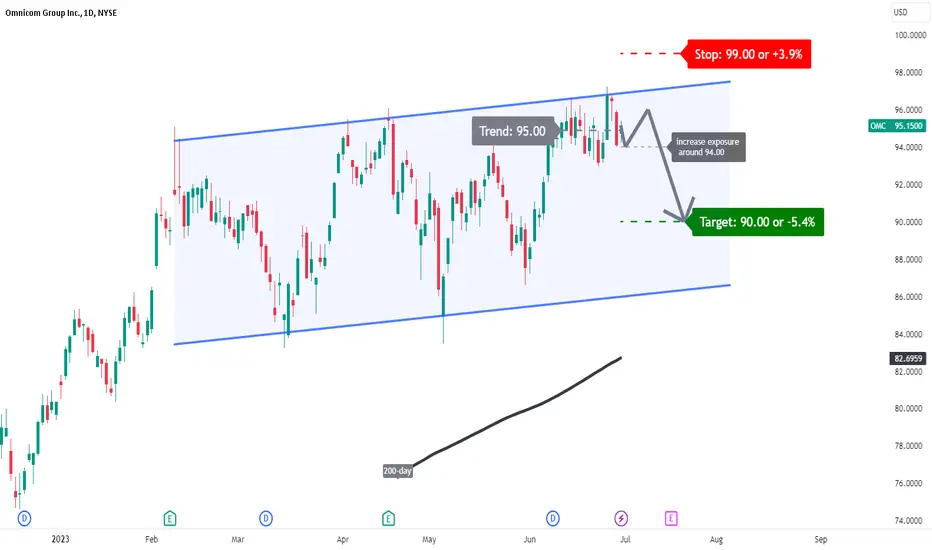
OMC: temporary correction?A price action below 95 supports a bearish trend direction.
Bearish confirmation further supported for a break below 94.
Teh target price is set at 90.
The stop-loss price is set at 99.
A temporary correction in an inclining channel pattern seems likely.
OMC - Extended Right Arm of W PatternOMC has a nice W pattern angled right here.
I expect the right arm of the W to extend higher than the rest.
I have shown this extension to resistance in thick green, with the bars pattern tool.
Numbers 1,2,3 are just counting the W pattern.

$OMC with a Bullish outlook following its earnings #Stocks The PEAD projected a Bullish outlook for $OMC after a Positive over reaction following its earnings release placing the stock in drift B with an expected accuracy of 75%.

OMC - Ascending Triangle Breakout PotentialOMC has formed a large Ascending triangle / bullish rising wedge on this 3D timeframe This will likely break out to the upside as indicated by the double curve

$OMC with a Bullish outlook following its earnings #Stocks The PEAD projected a Bullish outlook for $OMC after a Positive over reaction following its earnings release placing the stock in drift B with an expected accuracy of 71.43%.

QuickTradeStop at $68.
Bullish cross already happened.
Not a good looking RSI
Don't let the white cross down the blue EMA.

Long | OMCNYSE:OMC
Possible Scenario: LONG
Evidence: Price Action
TP1~ 82.80$
Call options, Strike 80$, 05/21/21
This is my idea and could be wrong 100%,

See all ideas
Summarizing what the indicators are suggesting.
Neutral
SellBuy
Strong sellStrong buy
Strong sellSellNeutralBuyStrong buy
Neutral
SellBuy
Strong sellStrong buy
Strong sellSellNeutralBuyStrong buy
Neutral
SellBuy
Strong sellStrong buy
Strong sellSellNeutralBuyStrong buy
An aggregate view of professional's ratings.
Neutral
SellBuy
Strong sellStrong buy
Strong sellSellNeutralBuyStrong buy
Neutral
SellBuy
Strong sellStrong buy
Strong sellSellNeutralBuyStrong buy
Neutral
SellBuy
Strong sellStrong buy
Strong sellSellNeutralBuyStrong buy
Frequently Asked Questions
The current price of 1OMC is 60.88 EUR — it has increased by 0.36% in the past 24 hours. Watch OMNICOM GROUP INC stock price performance more closely on the chart.
Depending on the exchange, the stock ticker may vary. For instance, on MIL exchange OMNICOM GROUP INC stocks are traded under the ticker 1OMC.
1OMC stock has fallen by −0.59% compared to the previous week, the month change is a −8.01% fall, over the last year OMNICOM GROUP INC has showed a −8.70% decrease.
We've gathered analysts' opinions on OMNICOM GROUP INC future price: according to them, 1OMC price has a max estimate of 99.83 EUR and a min estimate of 70.05 EUR. Watch 1OMC chart and read a more detailed OMNICOM GROUP INC stock forecast: see what analysts think of OMNICOM GROUP INC and suggest that you do with its stocks.
1OMC reached its all-time high on May 13, 2025 with the price of 69.76 EUR, and its all-time low was 61.24 EUR and was reached on Jun 13, 2025. View more price dynamics on 1OMC chart.
See other stocks reaching their highest and lowest prices.
See other stocks reaching their highest and lowest prices.
1OMC stock is 0.36% volatile and has beta coefficient of 0.85. Track OMNICOM GROUP INC stock price on the chart and check out the list of the most volatile stocks — is OMNICOM GROUP INC there?
Today OMNICOM GROUP INC has the market capitalization of 11.93 B, it has increased by 0.35% over the last week.
Yes, you can track OMNICOM GROUP INC financials in yearly and quarterly reports right on TradingView.
OMNICOM GROUP INC is going to release the next earnings report on Jul 22, 2025. Keep track of upcoming events with our Earnings Calendar.
1OMC earnings for the last quarter are 1.57 EUR per share, whereas the estimation was 1.52 EUR resulting in a 3.24% surprise. The estimated earnings for the next quarter are 1.74 EUR per share. See more details about OMNICOM GROUP INC earnings.
OMNICOM GROUP INC revenue for the last quarter amounts to 3.41 B EUR, despite the estimated figure of 3.43 B EUR. In the next quarter, revenue is expected to reach 3.45 B EUR.
1OMC net income for the last quarter is 265.93 M EUR, while the quarter before that showed 432.76 M EUR of net income which accounts for −38.55% change. Track more OMNICOM GROUP INC financial stats to get the full picture.
Yes, 1OMC dividends are paid quarterly. The last dividend per share was 0.61 EUR. As of today, Dividend Yield (TTM)% is 3.98%. Tracking OMNICOM GROUP INC dividends might help you take more informed decisions.
OMNICOM GROUP INC dividend yield was 3.25% in 2024, and payout ratio reached 37.56%. The year before the numbers were 3.24% and 40.53% correspondingly. See high-dividend stocks and find more opportunities for your portfolio.
As of Jun 22, 2025, the company has 74.9 K employees. See our rating of the largest employees — is OMNICOM GROUP INC on this list?
EBITDA measures a company's operating performance, its growth signifies an improvement in the efficiency of a company. OMNICOM GROUP INC EBITDA is 2.37 B EUR, and current EBITDA margin is 16.50%. See more stats in OMNICOM GROUP INC financial statements.
Like other stocks, 1OMC shares are traded on stock exchanges, e.g. Nasdaq, Nyse, Euronext, and the easiest way to buy them is through an online stock broker. To do this, you need to open an account and follow a broker's procedures, then start trading. You can trade OMNICOM GROUP INC stock right from TradingView charts — choose your broker and connect to your account.