Stanley Black Stock Quote | Chart & Forecast SummaryKey Indicators On Trade Set Up In General
1. Push Set Up
2. Range Set up
3. Break & Retest Set Up
Notes On Session
# Stanley Black Stock Quote
- Double Formation
* (EMA Settings)) | Completed Survey
* (No Trade)) + Inverted Structure | Subdivision 1
- Triple Formation
* (Flag Structure) & Short Set
Next report date
—
Report period
—
EPS estimate
—
Revenue estimate
—
2.18 EUR
276.56 M EUR
14.84 B EUR
154.19 M
About Stanley Black & Decker, Inc.
Sector
Industry
CEO
Donald Allan
Website
Headquarters
New Britain
Founded
1843
FIGI
BBG01TNWXPF1
Stanley Black & Decker, Inc. engages in the provision of power and hand tools, and related accessories, products, services and equipment for oil and gas, infrastructure applications, commercial electronic security and monitoring systems, healthcare solutions, and mechanical access solutions. It operates through the Tools and Outdoor and Industrial segments. The Tools and Outdoor segment refers to power tools, hand tools, accessories and storage, and outdoor power equipment product lines. The Industrial segment includes the engineered fastening and infrastructure businesses. The company was founded by Frederick T. Stanley in 1843 and is headquartered in New Britain, CT.
Related stocks

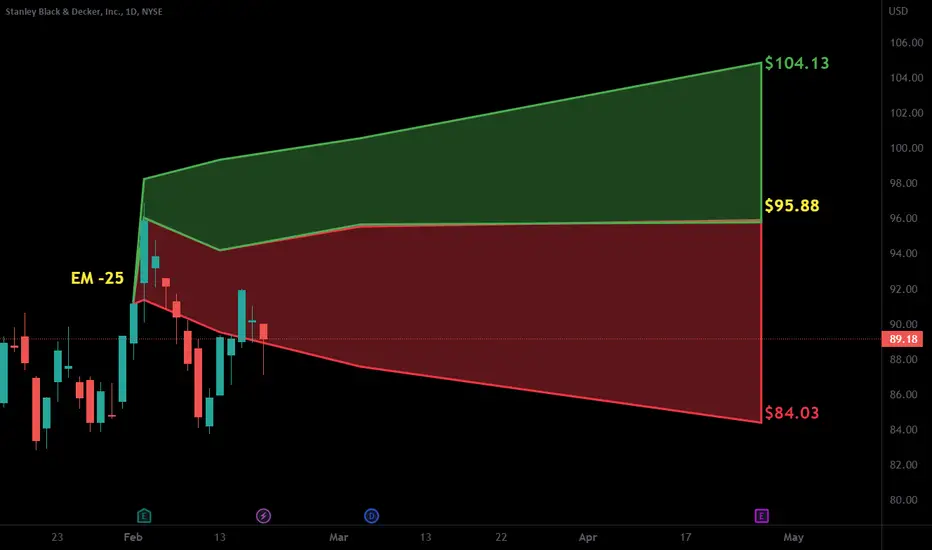
SWK: Bullish Potential, Key Levels to WatchClick Here🖱️ and scroll down👇 for the technicals, and more behind this analysis!!!
________________________________________________________
________________________________________________________
..........✋NFA👍..........
📈Technical/Fundamental/Target Standpoint⬅️
1.) Directional Bias: A slight

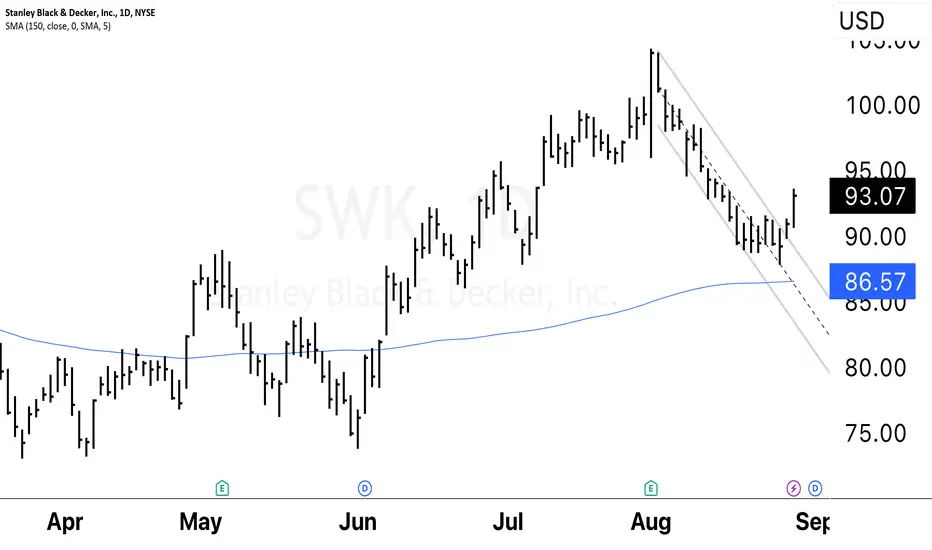
Stanley Black & Decker | SWK | Long at $85.00Stanley Black and Decker NYSE:SWK breached my selected historical simple moving average and may likely be forming an upward channel into an overall positive reversal. It's "obeying" the simple moving average lines so far, with a nice bounce off the base at $85. Earnings and cash flow are expected

Swing 1H trade LONG Hi check my oportunity. We go on 1h long position i trust X2 or X5 good risk reward. Good Luck. L.

Stanley Black & Decker Surges Why?Stanley Black & Decker shares jumped more than 8% Saturday after it boosted its profit forecast for the year. The tool maker said its cost-cutting efforts are paying off. Stanley now expects $1.10 to $1.40 in adjusted earnings per share in 2023, up from its past guidance of $0.70 to $1.30.
The tool

$SWK Bearish Parallel Down Trend BreakNYSE:SWK Bearish Parallel Down Trend Break to bullish reversal. The analysis of the potential bearish-to-bullish reversal in the context of NYSE:SWK (Stanley Black & Decker, Inc.) involves examining key price movements and technical patterns. Specifically, the break of a parallel down trend and i
SWK - Head and shouldersOn this chart, we can see a head and shoulders-formation and we are therefore waiting for a breakout of the neckline, to take our short position.
Stop-loss, target and ROI are all shown on the chart.
The target for this trade equals the earlier support level.
In this case, it shows that during the

$SWK with a Bullish outlook following its earnings #Stocks The PEAD projected a bullish outlook for $SWK after a positive under reaction following its earnings release placing the stock in drift A with an expected accuracy of 100%.

SWK protective options strategyEveryone has some trusty item made by Stanley Black & Decker in their home, whether it's a power tool, lawn product, kitchen appliance, storage, etc. Its customers also include professional end users of its equipment for repairs, construction, lawncare, automotive, manufacturing, oil and gas pipelin

See all ideas
Summarizing what the indicators are suggesting.
Neutral
SellBuy
Strong sellStrong buy
Strong sellSellNeutralBuyStrong buy
Neutral
SellBuy
Strong sellStrong buy
Strong sellSellNeutralBuyStrong buy
Neutral
SellBuy
Strong sellStrong buy
Strong sellSellNeutralBuyStrong buy
An aggregate view of professional's ratings.
Neutral
SellBuy
Strong sellStrong buy
Strong sellSellNeutralBuyStrong buy
Neutral
SellBuy
Strong sellStrong buy
Strong sellSellNeutralBuyStrong buy
Neutral
SellBuy
Strong sellStrong buy
Strong sellSellNeutralBuyStrong buy
SWK5072777
Stanley Black & Decker, Inc. 2.75% 15-NOV-2050Yield to maturity
7.93%
Maturity date
Nov 15, 2050
SWK4946495
Stanley Black & Decker, Inc. 6.6768% 15-MAR-2060Yield to maturity
6.93%
Maturity date
Mar 15, 2060
SWK5367010
Stanley Black & Decker, Inc. 3.0% 15-MAY-2032Yield to maturity
5.63%
Maturity date
May 15, 2032
SWK4946497
Stanley Black & Decker, Inc. 2.3% 15-MAR-2030Yield to maturity
5.35%
Maturity date
Mar 15, 2030
SWK5549971
Stanley Black & Decker, Inc. 6.272% 06-MAR-2026Yield to maturity
5.08%
Maturity date
Mar 6, 2026
SWK4804224
Stanley Black & Decker, Inc. 3.4% 01-MAR-2026Yield to maturity
4.54%
Maturity date
Mar 1, 2026
SWK5549972
Stanley Black & Decker, Inc. 6.0% 06-MAR-2028Yield to maturity
4.21%
Maturity date
Mar 6, 2028
See all 1SWK bonds
Frequently Asked Questions
The current price of 1SWK is 56.36 EUR — it has decreased by −0.32% in the past 24 hours. Watch STANLEY B&D stock price performance more closely on the chart.
Depending on the exchange, the stock ticker may vary. For instance, on MIL exchange STANLEY B&D stocks are traded under the ticker 1SWK.
1SWK stock has fallen by −1.74% compared to the previous week, the month change is a −6.90% fall, over the last year STANLEY B&D has showed a 5.31% increase.
We've gathered analysts' opinions on STANLEY B&D future price: according to them, 1SWK price has a max estimate of 89.78 EUR and a min estimate of 52.81 EUR. Watch 1SWK chart and read a more detailed STANLEY B&D stock forecast: see what analysts think of STANLEY B&D and suggest that you do with its stocks.
1SWK reached its all-time high on May 13, 2025 with the price of 65.56 EUR, and its all-time low was 51.98 EUR and was reached on Apr 30, 2025. View more price dynamics on 1SWK chart.
See other stocks reaching their highest and lowest prices.
See other stocks reaching their highest and lowest prices.
1SWK stock is 0.32% volatile and has beta coefficient of 1.15. Track STANLEY B&D stock price on the chart and check out the list of the most volatile stocks — is STANLEY B&D there?
Today STANLEY B&D has the market capitalization of 8.69 B, it has decreased by −0.59% over the last week.
Yes, you can track STANLEY B&D financials in yearly and quarterly reports right on TradingView.
STANLEY B&D is going to release the next earnings report on Jul 29, 2025. Keep track of upcoming events with our Earnings Calendar.
1SWK earnings for the last quarter are 0.69 EUR per share, whereas the estimation was 0.61 EUR resulting in a 14.58% surprise. The estimated earnings for the next quarter are 0.34 EUR per share. See more details about STANLEY B&D earnings.
STANLEY B&D revenue for the last quarter amounts to 3.46 B EUR, despite the estimated figure of 3.41 B EUR. In the next quarter, revenue is expected to reach 3.49 B EUR.
1SWK net income for the last quarter is 83.56 M EUR, while the quarter before that showed 188.27 M EUR of net income which accounts for −55.62% change. Track more STANLEY B&D financial stats to get the full picture.
Yes, 1SWK dividends are paid quarterly. The last dividend per share was 0.72 EUR. As of today, Dividend Yield (TTM)% is 5.07%. Tracking STANLEY B&D dividends might help you take more informed decisions.
As of Jun 22, 2025, the company has 48.5 K employees. See our rating of the largest employees — is STANLEY B&D on this list?
EBITDA measures a company's operating performance, its growth signifies an improvement in the efficiency of a company. STANLEY B&D EBITDA is 1.75 B EUR, and current EBITDA margin is 12.62%. See more stats in STANLEY B&D financial statements.
Like other stocks, 1SWK shares are traded on stock exchanges, e.g. Nasdaq, Nyse, Euronext, and the easiest way to buy them is through an online stock broker. To do this, you need to open an account and follow a broker's procedures, then start trading. You can trade STANLEY B&D stock right from TradingView charts — choose your broker and connect to your account.