MONGDOINIn the weekly time it has had two failures
But the green line was too important for me to break
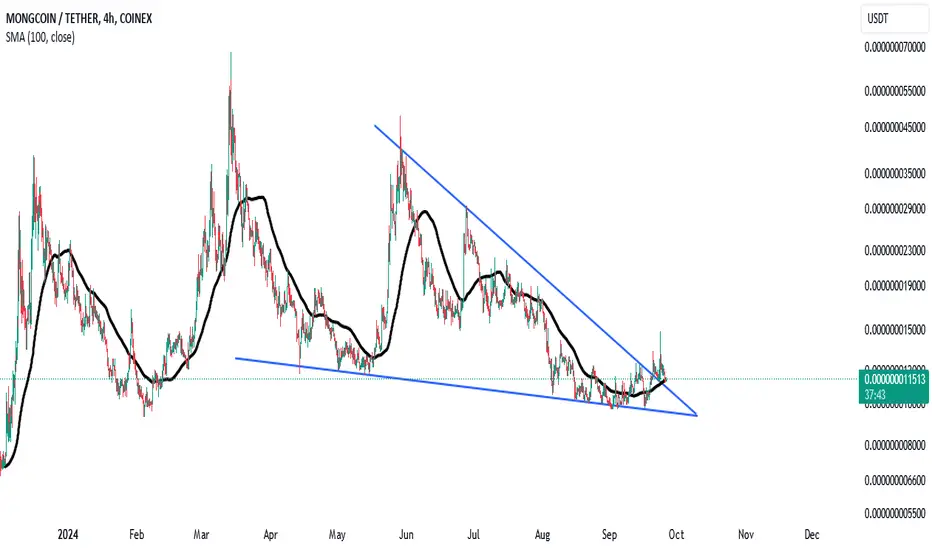
Now it has a small resistance in the red box
Related pairs

A 10X trade for MONG This is a huge symmetrical triangle on the weekly time frame a breakout from here is a 10X potential.
on the other hand, on the monthly time frame, you will see a leading diagonal and its correction representing the wave 1 and wave 2. Meaning we are about having wave 3 which will be huge. IMO.
Thi

Ready to launch, don't miss MONGThe heavy accumulations in the last month by the big whales of the market show the explosive movement of this meme, don't neglect buying and holding, it behaves like Turbo.

Heavy accumulation, big pump 2024 for MONGUSDTVery heavy accumulation in the wallets of large currency holders indicates a heavy jump in the price of this currency, the time and price correction is nearing its end, wait and enjoy the fruit.
BULLLISH MOMENTUM TO START SOONSmart Money contraction value lines are areas where trends get rejected or if a trend passes the value line, usually returns to the value line. Smart Money creates these through consolidation.
It's a way how they communicate with one another.
The white rectangle is the buying zone. This area read

mong's next move after bitcoin stabilizationConsidering that mong has reached the corner of the triangle and the price floor, it is likely to take a strong upward movement
Especially since during the growth of many altcoins, mong did not grow significantly
Since the market cap of this currency is very low, even if it grows ten times, the mark

Mongusdt Trading opportunityMongusdt is showing signs of a potential impulsive wave following a breakthrough of a strong bearish trend. The coin has completed 5 downward waves.
The buyback zone presents a favorable area for coin accumulation, while the external demand area serves as a crucial support level to monitor in case

ready to fly , big pump for MONGGet ready for the biggest pump ever, given the compact size, increased holders, and attractive patterns
Community Verified icon

MONGUSDT - Important Trend LineTrend Line in white has been providing support for price and is currently being tested
I expect a bullish bounce off this line upwards and for the bull market to enter a more aggressive phase.
Bars pattern in green just shows my bull thoughts.
Trend Line Analysis
Daily Chart

After bonk , pepe, turbo, it's time for mongCharts talk to you.
Take a look at the mong chart.
Volumes, breaks, liquidity limits.
I strongly believe in it.
It will have a good flight.
Accumulations have increased and
Attractive transactions of mong whales

See all ideas
Summarizing what the indicators are suggesting.
Oscillators
Neutral
SellBuy
Strong sellStrong buy
Strong sellSellNeutralBuyStrong buy
Oscillators
Neutral
SellBuy
Strong sellStrong buy
Strong sellSellNeutralBuyStrong buy
Summary
Neutral
SellBuy
Strong sellStrong buy
Strong sellSellNeutralBuyStrong buy
Summary
Neutral
SellBuy
Strong sellStrong buy
Strong sellSellNeutralBuyStrong buy
Summary
Neutral
SellBuy
Strong sellStrong buy
Strong sellSellNeutralBuyStrong buy
Moving Averages
Neutral
SellBuy
Strong sellStrong buy
Strong sellSellNeutralBuyStrong buy
Moving Averages
Neutral
SellBuy
Strong sellStrong buy
Strong sellSellNeutralBuyStrong buy
Displays a symbol's price movements over previous years to identify recurring trends.
Frequently Asked Questions
The current price of MongCoin / Tether USD (MONG) is 0.000000000531 USDT — it hasn't changed in the past 24 hours. Try placing this info into the context by checking out what coins are also gaining and losing at the moment and seeing MONG price chart.
MongCoin / Tether USD price has fallen by −20.15% over the last week, its month performance shows a −11.65% decrease, and as for the last year, MongCoin / Tether USD has decreased by −95.10%. See more dynamics on MONG price chart.
Keep track of coins' changes with our Crypto Coins Heatmap.
Keep track of coins' changes with our Crypto Coins Heatmap.
MongCoin / Tether USD (MONG) reached its highest price on May 11, 2023 — it amounted to 0.000002500000 USDT. Find more insights on the MONG price chart.
See the list of crypto gainers and choose what best fits your strategy.
See the list of crypto gainers and choose what best fits your strategy.
MongCoin / Tether USD (MONG) reached the lowest price of 0.000000000410 USDT on May 9, 2025. View more MongCoin / Tether USD dynamics on the price chart.
See the list of crypto losers to find unexpected opportunities.
See the list of crypto losers to find unexpected opportunities.
The safest choice when buying MONG is to go to a well-known crypto exchange. Some of the popular names are Binance, Coinbase, Kraken. But you'll have to find a reliable broker and create an account first. You can trade MONG right from TradingView charts — just choose a broker and connect to your account.
Crypto markets are famous for their volatility, so one should study all the available stats before adding crypto assets to their portfolio. Very often it's technical analysis that comes in handy. We prepared technical ratings for MongCoin / Tether USD (MONG): today its technical analysis shows the sell signal, and according to the 1 week rating MONG shows the sell signal. And you'd better dig deeper and study 1 month rating too — it's sell. Find inspiration in MongCoin / Tether USD trading ideas and keep track of what's moving crypto markets with our crypto news feed.
MongCoin / Tether USD (MONG) is just as reliable as any other crypto asset — this corner of the world market is highly volatile. Today, for instance, MongCoin / Tether USD is estimated as 7.34% volatile. The only thing it means is that you must prepare and examine all available information before making a decision. And if you're not sure about MongCoin / Tether USD, you can find more inspiration in our curated watchlists.
You can discuss MongCoin / Tether USD (MONG) with other users in our public chats, Minds or in the comments to Ideas.