MONGDOINIn the weekly time it has had two failures
But the green line was too important for me to break
Now it has a small resistance in the red box
MONGUSDT trade ideas

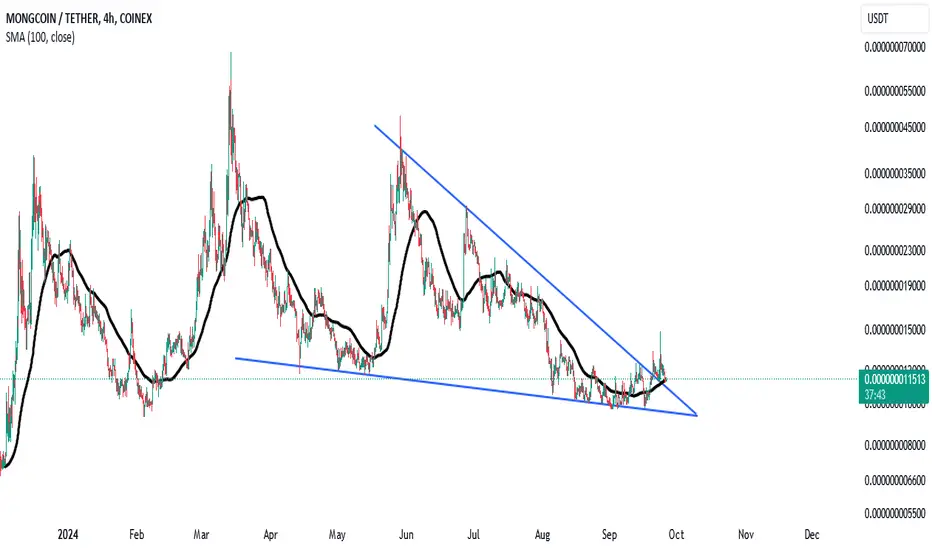
A 10X trade for MONG This is a huge symmetrical triangle on the weekly time frame a breakout from here is a 10X potential.
on the other hand, on the monthly time frame, you will see a leading diagonal and its correction representing the wave 1 and wave 2. Meaning we are about having wave 3 which will be huge. IMO.
This is not a financial advice. DYOR.

Ready to launch, don't miss MONGThe heavy accumulations in the last month by the big whales of the market show the explosive movement of this meme, don't neglect buying and holding, it behaves like Turbo.

Heavy accumulation, big pump 2024 for MONGUSDTVery heavy accumulation in the wallets of large currency holders indicates a heavy jump in the price of this currency, the time and price correction is nearing its end, wait and enjoy the fruit.
BULLLISH MOMENTUM TO START SOONSmart Money contraction value lines are areas where trends get rejected or if a trend passes the value line, usually returns to the value line. Smart Money creates these through consolidation.
It's a way how they communicate with one another.
The white rectangle is the buying zone. This area reads freedom for the price to move up anywhere.
Blue Wave Bull Plot is about to light up a match to start the rocket launch. Has been ready since July 25th.
Stochastic RSI may have to move up, down, and then back up twice on a 1D TF but you must hop to a 3D TF to get an idea of which if I were trading MONGU, I'd go long and use a 3D TF and I would not pay any attention to the HERD NOISE.
If I were to use a lower timeframe then I'm setting myself up to sell out of panic. Anything above 88 in the stochastic RSI is super bullish.
I also wouldn't enter the trade until the trend reaches the white rectangle at 0.000000041280
Anyone must expect delays if you bought below the white rectangle

mong's next move after bitcoin stabilizationConsidering that mong has reached the corner of the triangle and the price floor, it is likely to take a strong upward movement
Especially since during the growth of many altcoins, mong did not grow significantly
Since the market cap of this currency is very low, even if it grows ten times, the market cap will not be very high. It is currently operating with a market cap of 11 million.
Turbo with 380 million, Pepe with 5 billion, Floki with 1.7 billion, Wojack with 68 million market cap

Mongusdt Trading opportunityMongusdt is showing signs of a potential impulsive wave following a breakthrough of a strong bearish trend. The coin has completed 5 downward waves.
The buyback zone presents a favorable area for coin accumulation, while the external demand area serves as a crucial support level to monitor in case the buyback zone fails. Projected targets have been indicated on the chart.
Your engagement with our current findings is greatly appreciated. Thank you.

ready to fly , big pump for MONGGet ready for the biggest pump ever, given the compact size, increased holders, and attractive patterns
Community Verified icon

MONGUSDT - Important Trend LineTrend Line in white has been providing support for price and is currently being tested
I expect a bullish bounce off this line upwards and for the bull market to enter a more aggressive phase.
Bars pattern in green just shows my bull thoughts.
Trend Line Analysis
Daily Chart

After bonk , pepe, turbo, it's time for mongCharts talk to you.
Take a look at the mong chart.
Volumes, breaks, liquidity limits.
I strongly believe in it.
It will have a good flight.
Accumulations have increased and
Attractive transactions of mong whales

MONGUSDTHello traders hope you are enjoying our Analysis.
Now we are here again with a new trading opportunity ,we will discuss today about mongUSDT
smart money concept analysis: Don't get caught in whale traps. What do you think of this idea? What is your opinion? Share it in the comments📄🖌 If you like the idea, please give it a like. This is the best "Thank you!" for the author

MONGUSDTThe price reaches an important support level and is bullish.
Risk warning and disclaimer...!

Bullish Analysis of the MONGUSDT ChartBullish Analysis of the MONGUSDT Chart
The chart of MONGUSDT on the 1-day timeframe is displaying highly bullish signs, suggesting a strong potential for upward momentum. Here are the key points:
1. Market Structure Change:
- The chart marks a significant "Market Structure Change" where the trend transitioned from lower highs and lower lows to higher highs and higher lows. This is a clear indication of a shift from a bearish to a bullish trend.
2. Higher Highs and Higher Lows:
- The formation of higher highs and higher lows is a textbook indication of a bullish trend. This pattern demonstrates consistent buying pressure and suggests that the market participants are increasingly willing to buy at higher prices.
- The latest higher low is well-supported by an ascending trendline, adding to the bullish sentiment.
3. Strong Support Levels:
- The green ascending trendline shows that the price is respecting a strong upward support level. This trendline acts as a foundation for the bullish trend, preventing the price from falling below it.
4. Exponential Moving Averages (EMAs):
- The shorter-term EMA (likely the 50-day EMA) has crossed above the longer-term EMA (likely the 200-day EMA), forming a "Golden Cross." This crossover is a powerful bullish signal indicating the potential for sustained upward momentum.
5. Volume and Momentum Indicators:
- The increase in volume during the higher high formations suggests that the upward moves are supported by strong buying interest.
- Momentum indicators, such as the Relative Strength Index (RSI) at the bottom of the chart, are likely trending upwards, further confirming the bullish momentum.
6. Potential for Explosive Move:
- The purple arrow pointing upwards on the chart symbolizes a potential explosive move to the upside. This suggests that the market could experience a significant rally, propelled by the bullish market structure and strong support levels.
### Summary
The MONGUSDT chart presents a highly bullish scenario with clear higher highs and higher lows, a market structure change, strong support levels, and bullish technical indicators such as the Golden Cross. The combination of these factors indicates a robust potential for an upward breakout, making it an exciting opportunity for investors and traders. Keep an eye on the price action around the ascending trendline and the formation of new higher highs for confirmation of continued bullish momentum.

Mong - all way up!MONG is create a massive compression around the 0.0...34 level!
The growth of the volumes are sustaining the break out and it can lead to great massive pump like we have seen in Ladys!
remember that is the meme momentum and that be a good start for this "s**t" coin.
Good trading!

MONGUSDT- Repeating cycle minimum target 500%$MONG weekly pattern is very similar and easy to trade
After every pump retest 65-80% for next 500%+

MONG: $0.000 000 0 835 Follow the Money cashing out from early accumulation is life changing experience
buying late or in between the PLAY is a Disaster
waiting is the key
waiting for that one RED BIG CANDLE or exhaustion of liquidity
for HANDLER to pick up or buy back FLOAT for next run up
in about 100day

🔔Trade Idea #MONG/USDT:#MongCoin is about to moon? It breaks through its massive resistance level. The charts look pretty bullish at the moment.

Mong .. Seems to be a trend here.. Looking at the gann you can see everytime price has come down to the bottom of the gann and slipped outside of it.. there has been a bounce.. doesnt mean this will continue.. but it looks like its moved back into the gann..

Mong looking good herestart accumalting mong as more exchanges are starting to list it.
could be the next great meme coin

MONG MEME COIN (Bottom in?) Just For Fun MONG can go even lower... a basic rule with all MEME coins
This chart is more experimental
Not a financial advice to risk money into this MEME coins
Is just for fun and that s it.
About
This name of this coin was made up by Mr.Sherman during a brief interview -
(watch the video on the website)
The MongMob was born out of the incoherent ramblings of a US congressman. Mongs are immortal, surviving both rugs, and bear markets. They value friendship, degenerate meme culture, and good vibes. If you align with these values grab some $MONG and welcome to the mob.
DYOR

MONG/USDT 97% Down in 30 Days Important Crypto Investment Reminder
Be cautious of rug pulls!
Crypto investors, beware of recent incidents like the Mong Coin price drop of almost 97% in just 30 days!
It's crucial to diversify your investments and avoid allocating too much of your funds to a single coin.
Diversification is key!
By spreading your investments across multiple coins, you can reduce the impact of any individual coin's performance on your portfolio. Diversifying helps mitigate risks and provides a safety net against sudden price drops like the one experienced by Mong Coin.
Example Case:
On 6th May 2023, the price of $Mong was $0.00000038. If you had invested $1000 in #MONG/USDT at that time, your investment would now be worth approximately $35, resulting in a significant loss.
Stay systematic and informed!
To make smart investments, conduct thorough research, and consider the underlying fundamentals of a project before committing your funds. It's recommended to follow a systematic investment strategy and approach to minimize risks and increase the chances of achieving your financial goals.
Stay vigilant and happy investing!

Come to papa lol This meme coin has to come to the White line , yellow line final defence line before another bounce (300% max pump)
Let’s see how it goes!

