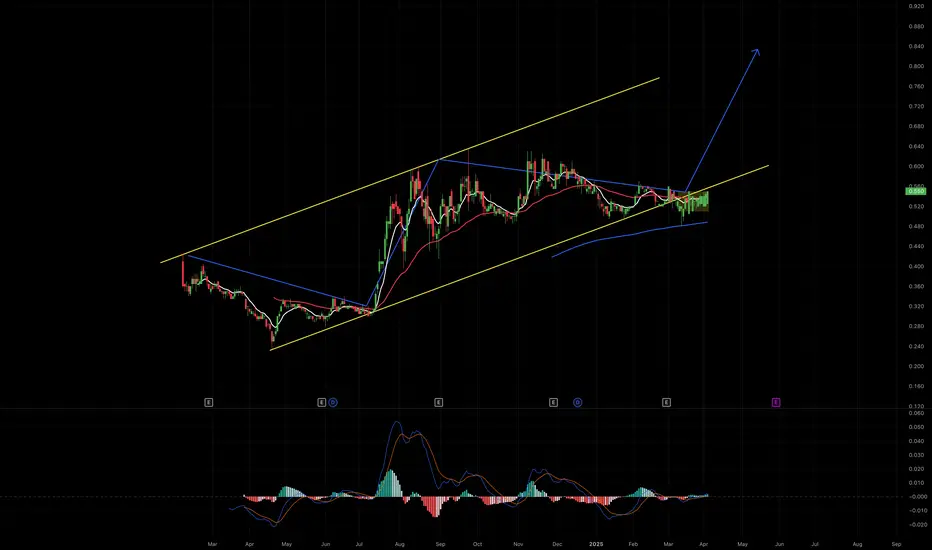
AGX - Bullish Wedge Bullish Wedge CP Pattern on the Daily Timeframe (Daily TF)
The Bullish Wedge CP (Continuation Pattern) is a technical chart pattern that signals a potential uptrend continuation after a period of consolidation. On the daily timeframe, this pattern can provide strong signals for medium to long-term e
Next report date
—
Report period
—
EPS estimate
—
Revenue estimate
—
0.040 MYR
12.74 M MYR
238.44 M MYR
350.98 M
About AGX GROUP BERHAD
Sector
Industry
CEO
Periasamy Ponnudorai
Website
Headquarters
Subang Jaya
Founded
2004
ISIN
MYQ0299OO006
FIGI
BBG01L0KV1Q2
AGX Group Bhd. engages in the provision of logistics services. It operates in the following geographical segments: Malaysia, Singapore, Philippines, Myanmar, Korea and Vietnam. The company was founded in 2004 and is headquartered in Subang Jaya, Malaysia.
Related stocks
AGX GROUP BERHADAGX GROUP BERHAD
Trend: The stock has shown a strong upward trend recently, with a significant price increase from late July to early August.
Support and Resistance: The current price seems to be encountering resistance around the 0.545 level (marked as "High" on the chart). Support levels could

AGX, below IPO price.Listed since February. Currently below IPO price.
>> Price below Hull MA
>> Oversold counter
Didn't see any strong reversal. Either skip or monitor if interested into this counter.
When a stock / index has gone up substantially, we must be more care if we decide to get involve in it...
monitor

See all ideas
Summarizing what the indicators are suggesting.
Neutral
SellBuy
Strong sellStrong buy
Strong sellSellNeutralBuyStrong buy
Neutral
SellBuy
Strong sellStrong buy
Strong sellSellNeutralBuyStrong buy
Neutral
SellBuy
Strong sellStrong buy
Strong sellSellNeutralBuyStrong buy
An aggregate view of professional's ratings.
Neutral
SellBuy
Strong sellStrong buy
Strong sellSellNeutralBuyStrong buy
Neutral
SellBuy
Strong sellStrong buy
Strong sellSellNeutralBuyStrong buy
Neutral
SellBuy
Strong sellStrong buy
Strong sellSellNeutralBuyStrong buy
Displays a symbol's price movements over previous years to identify recurring trends.
Frequently Asked Questions
The current price of AGX is 0.545 MYR — it has decreased by −0.91% in the past 24 hours. Watch AGX GROUP BERHAD stock price performance more closely on the chart.
Depending on the exchange, the stock ticker may vary. For instance, on MYX exchange AGX GROUP BERHAD stocks are traded under the ticker AGX.
AGX stock has fallen by −0.91% compared to the previous week, the month change is a 10.10% rise, over the last year AGX GROUP BERHAD has showed a 70.31% increase.
We've gathered analysts' opinions on AGX GROUP BERHAD future price: according to them, AGX price has a max estimate of 0.96 MYR and a min estimate of 0.96 MYR. Watch AGX chart and read a more detailed AGX GROUP BERHAD stock forecast: see what analysts think of AGX GROUP BERHAD and suggest that you do with its stocks.
AGX stock is 3.77% volatile and has beta coefficient of 0.00. Track AGX GROUP BERHAD stock price on the chart and check out the list of the most volatile stocks — is AGX GROUP BERHAD there?
Yes, you can track AGX GROUP BERHAD financials in yearly and quarterly reports right on TradingView.
AGX GROUP BERHAD is going to release the next earnings report on Aug 29, 2025. Keep track of upcoming events with our Earnings Calendar.
AGX net income for the last quarter is 4.53 M MYR, while the quarter before that showed 7.23 M MYR of net income which accounts for −37.34% change. Track more AGX GROUP BERHAD financial stats to get the full picture.
EBITDA measures a company's operating performance, its growth signifies an improvement in the efficiency of a company. AGX GROUP BERHAD EBITDA is 23.57 M MYR, and current EBITDA margin is 8.67%. See more stats in AGX GROUP BERHAD financial statements.
Like other stocks, AGX shares are traded on stock exchanges, e.g. Nasdaq, Nyse, Euronext, and the easiest way to buy them is through an online stock broker. To do this, you need to open an account and follow a broker's procedures, then start trading. You can trade AGX GROUP BERHAD stock right from TradingView charts — choose your broker and connect to your account.
Investing in stocks requires a comprehensive research: you should carefully study all the available data, e.g. company's financials, related news, and its technical analysis. So AGX GROUP BERHAD technincal analysis shows the buy rating today, and its 1 week rating is buy. Since market conditions are prone to changes, it's worth looking a bit further into the future — according to the 1 month rating AGX GROUP BERHAD stock shows the strong buy signal. See more of AGX GROUP BERHAD technicals for a more comprehensive analysis.
If you're still not sure, try looking for inspiration in our curated watchlists.
If you're still not sure, try looking for inspiration in our curated watchlists.