CHEAT SETUP AMEFair fundamental company,instutional favourite.Currently forming a base of cheat setup.Looks for breakout of the base with high volume,to validate the setup.
Next report date
—
Report period
—
EPS estimate
—
Revenue estimate
—
0.14 MYR
92.09 M MYR
608.57 M MYR
189.51 M
About AME ELITE CONSORTIUM BERHAD
Sector
Industry
CEO
Teck Eng Tan
Website
Headquarters
Senai
Founded
1995
ISIN
MYL5293OO005
FIGI
BBG00QDD3363
AME Elite Consortium Bhd is an investment holding company, which engages in integrated industrial property development, construction, engineering services, and property management services provider. It operates through the following segments: Construction, Property Development, Engineering, and Investment Holding/ Property Investment and Management Services. The company was founded in 1995 and is headquartered in Senai, Malaysia.
Related stocks


AME = Pre Consolidation BreakoutTHIS IS NOT AN INVESTMENT ADVICE. TRADE CALLS ARE NOT PROVIDED. INFORMATION SHOWN ARE FOR TECHNICAL ANALYSIS PURPOSE.
DISCLAIMER
Please consider your own interpretation of Opportunity & Risk. The author of this post strictly follows the Malaysian Security Commission ( SC ) Guidelines on the prohib

AME is trading higherAME has made significant advances above Fibonacci resistance 1.618. The share could potentially reach our Fibonacci target at 2.88. On the flip side, the move below the 50-period MA of 2.0 could push the price lower to the support level at 1.76.
Disclaimer: The content on this analysis is subject t

Resistance & Divergence alertTrend is bullish, however a divergence seen on MACD coincide resistance level on Fibonacci level 1.618. If the price could break above 2.185 the rally would resume. Profit taking/reduce holding is advisable at current level.
Disclaimer: The content on this analysis is subject to change at any time

can it break on 2.19 and still up or drop to the 1.96 and 2.05 uptrend
bull in control
divergent happen
wait it retranance to 1.96, 2.05
support 1.9

EASY123 Prediction @MYX AMEPrediction: Sideway to Rally (When it breaks 1.89)
Target Price: R1=1.98-2.00, R2=2.18-2.22
Support/Cut Loss: S1=1.76, S2=1.66
*Trend direction: UPTREND - Higher-High & Higher-Low positive movement
*Price moves strongly above our Lifeline (Redline)
*Turning points (White-candle) have appeared on 14

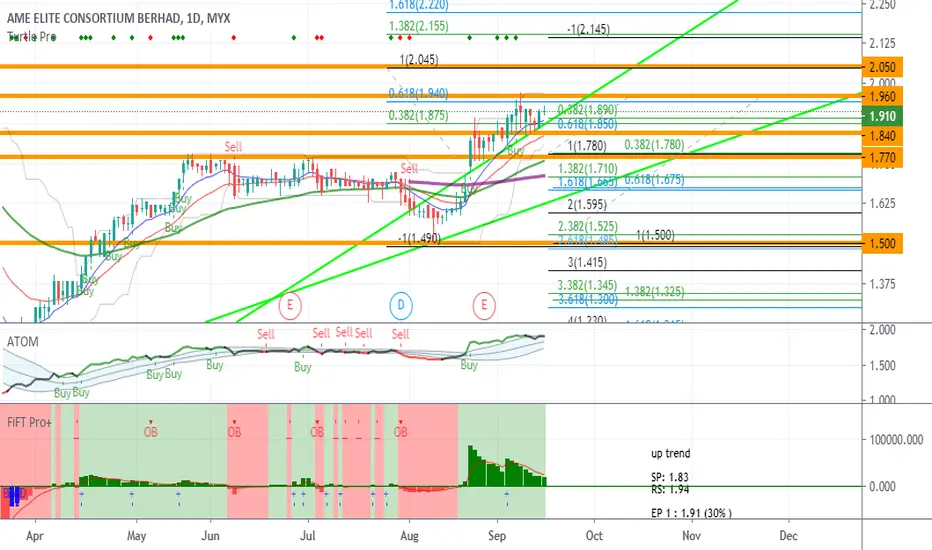
AME UP TREND BUY 30% FIRSTS TESTING up trend
SP: 1.83
RS: 1.94
EP 1 : 1.91 (30% )
BOB 1.94 ( 40 %)
EP 2 1.84 ( 30% )
CL 1.83
AME Into Wave 3 ?1 of TOP 15 below 1B company listed by Forbes
Banker's chip increase
Gap up after end of WAVE 2
Uptrend and Bullish
Monitor to Buy Up

top 20 jewel series of malaysia stocks : AME elite consortiumtop 20 jewels frm a very popular local bank...
fundamental : I don't know...
technical : let's look at some price action...
AME is newly listed in 2019, not quite much movement yet...basically, it is in sideway trend...now it has come to a critical level at RM1.70 support level and has been hangin

See all ideas
Summarizing what the indicators are suggesting.
Neutral
SellBuy
Strong sellStrong buy
Strong sellSellNeutralBuyStrong buy
Neutral
SellBuy
Strong sellStrong buy
Strong sellSellNeutralBuyStrong buy
Neutral
SellBuy
Strong sellStrong buy
Strong sellSellNeutralBuyStrong buy
An aggregate view of professional's ratings.
Neutral
SellBuy
Strong sellStrong buy
Strong sellSellNeutralBuyStrong buy
Neutral
SellBuy
Strong sellStrong buy
Strong sellSellNeutralBuyStrong buy
Neutral
SellBuy
Strong sellStrong buy
Strong sellSellNeutralBuyStrong buy
Displays a symbol's price movements over previous years to identify recurring trends.
Frequently Asked Questions
The current price of AME is 1.51 MYR — it hasn't changed in the past 24 hours. Watch AME ELITE CONSORTIUM BERHAD stock price performance more closely on the chart.
Depending on the exchange, the stock ticker may vary. For instance, on MYX exchange AME ELITE CONSORTIUM BERHAD stocks are traded under the ticker AME.
AME stock has fallen by −2.58% compared to the previous week, the month change is a −4.43% fall, over the last year AME ELITE CONSORTIUM BERHAD has showed a −10.12% decrease.
We've gathered analysts' opinions on AME ELITE CONSORTIUM BERHAD future price: according to them, AME price has a max estimate of 2.05 MYR and a min estimate of 1.92 MYR. Watch AME chart and read a more detailed AME ELITE CONSORTIUM BERHAD stock forecast: see what analysts think of AME ELITE CONSORTIUM BERHAD and suggest that you do with its stocks.
AME stock is 0.67% volatile and has beta coefficient of 0.67. Track AME ELITE CONSORTIUM BERHAD stock price on the chart and check out the list of the most volatile stocks — is AME ELITE CONSORTIUM BERHAD there?
Today AME ELITE CONSORTIUM BERHAD has the market capitalization of 967.42 M, it has decreased by −2.58% over the last week.
Yes, you can track AME ELITE CONSORTIUM BERHAD financials in yearly and quarterly reports right on TradingView.
AME ELITE CONSORTIUM BERHAD is going to release the next earnings report on Aug 21, 2025. Keep track of upcoming events with our Earnings Calendar.
AME net income for the last quarter is 36.54 M MYR, while the quarter before that showed 18.41 M MYR of net income which accounts for 98.52% change. Track more AME ELITE CONSORTIUM BERHAD financial stats to get the full picture.
AME ELITE CONSORTIUM BERHAD dividend yield was 3.55% in 2024, and payout ratio reached 41.64%. The year before the numbers were 3.41% and 41.18% correspondingly. See high-dividend stocks and find more opportunities for your portfolio.
EBITDA measures a company's operating performance, its growth signifies an improvement in the efficiency of a company. AME ELITE CONSORTIUM BERHAD EBITDA is 130.84 M MYR, and current EBITDA margin is 21.70%. See more stats in AME ELITE CONSORTIUM BERHAD financial statements.
Like other stocks, AME shares are traded on stock exchanges, e.g. Nasdaq, Nyse, Euronext, and the easiest way to buy them is through an online stock broker. To do this, you need to open an account and follow a broker's procedures, then start trading. You can trade AME ELITE CONSORTIUM BERHAD stock right from TradingView charts — choose your broker and connect to your account.
Investing in stocks requires a comprehensive research: you should carefully study all the available data, e.g. company's financials, related news, and its technical analysis. So AME ELITE CONSORTIUM BERHAD technincal analysis shows the sell today, and its 1 week rating is sell. Since market conditions are prone to changes, it's worth looking a bit further into the future — according to the 1 month rating AME ELITE CONSORTIUM BERHAD stock shows the sell signal. See more of AME ELITE CONSORTIUM BERHAD technicals for a more comprehensive analysis.
If you're still not sure, try looking for inspiration in our curated watchlists.
If you're still not sure, try looking for inspiration in our curated watchlists.