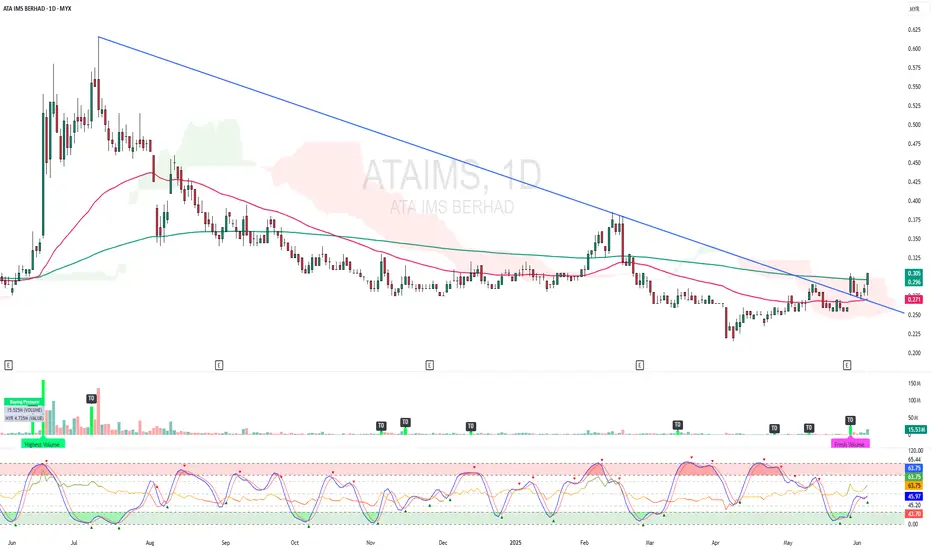
ATAIMS - BREAKOUT EMA 200 and CLOUD !ATAIMS - CURRENT PRICE : RM0.305
ATAIMS is bullish as the price is above EMA 50 and 200. The stock broke above EMA 200 and ICHIMOKU CLOUD on last FRIDAY (06 JUNE 2025) with high volume. Supported by technical reading in RSI heading upward, the stock may continue to move higher in the upcoming sess
Next report date
—
Report period
—
EPS estimate
—
Revenue estimate
—
−0.005 MYR
−4.38 M MYR
274.58 M MYR
325.55 M
About ATA IMS BERHAD
Sector
Industry
CEO
Chiu Wan Fong
Website
Headquarters
Johor Bahru
Founded
1972
ISIN
MYL8176OO009
FIGI
BBG000BG2T87
ATA IMS Bhd. operates as an investment holding company, which engages in the manufacturing and sales of precision plastic injection of moulded parts, secondary process, sub assembly, and full assembly of the finished products for the electronic industry. The company was founded in 1972 and is headquartered in Johor Bahru, Malaysia.
Related stocks
ATAIMS - Analysis on the potential price movementN wave with E, N & NT projection.
The price recently broke above a descending trendline, now acting as potential support.
After breaking the trendline resistance, price attempted to push up but is currently retracing slightly.
The price is just inside the down Kumo (resistance).
The cloud is thick a

ATAIMS - Bullish bias?N wave with E, N, V & NT projection.
Price has broken above the Kumo, confirming a bullish reversal.
Tenkan-sen > Kijun-sen, supporting bullish momentum.
Chikou Span is above the price, indicating continued bullish sentiment.
The Kumo ahead is turning green, suggesting potential further upside.
NT L

ATAIMS - Potential on price movementY wave targeted (E) within stipulated time.
A death cross has occurred and need strong momentum to breakout minor downtrend line if price need to continue upwards. Expected golden cross to be happen if momentum keep upward and price must breakout 52w high to reach (E) and complete the Y wave.
R1 - S

ATAIMS - Updated on price analysis movementY Wave, target (E) within stipulated range. Need to breakout turning point (C) (52w high) to reach the target (E)
N wave with NT, N, V & E projection.
S - 0.405 (Tenkan sen)
R - 0.445 (Senko span B)
Note:
1. Analysis for education purposes only.
2. Trade on your own risk.


ATAIMS ready to take off?Price showed promising movement before market close. Buying interest is getting its momentum after it broke out both MA50 and MA200. TAYOR.


See all ideas
Summarizing what the indicators are suggesting.
Oscillators
Neutral
SellBuy
Strong sellStrong buy
Strong sellSellNeutralBuyStrong buy
Oscillators
Neutral
SellBuy
Strong sellStrong buy
Strong sellSellNeutralBuyStrong buy
Summary
Neutral
SellBuy
Strong sellStrong buy
Strong sellSellNeutralBuyStrong buy
Summary
Neutral
SellBuy
Strong sellStrong buy
Strong sellSellNeutralBuyStrong buy
Summary
Neutral
SellBuy
Strong sellStrong buy
Strong sellSellNeutralBuyStrong buy
Moving Averages
Neutral
SellBuy
Strong sellStrong buy
Strong sellSellNeutralBuyStrong buy
Moving Averages
Neutral
SellBuy
Strong sellStrong buy
Strong sellSellNeutralBuyStrong buy
Displays a symbol's price movements over previous years to identify recurring trends.
Frequently Asked Questions
The current price of ATAIMS is 0.260 MYR — it has decreased by −1.89% in the past 24 hours. Watch ATA IMS BERHAD stock price performance more closely on the chart.
Depending on the exchange, the stock ticker may vary. For instance, on MYX exchange ATA IMS BERHAD stocks are traded under the ticker ATAIMS.
ATAIMS stock has fallen by −8.77% compared to the previous week, the month change is a −1.89% fall, over the last year ATA IMS BERHAD has showed a −42.86% decrease.
ATAIMS reached its all-time high on Apr 14, 2021 with the price of 3.480 MYR, and its all-time low was 0.060 MYR and was reached on Mar 4, 2009. View more price dynamics on ATAIMS chart.
See other stocks reaching their highest and lowest prices.
See other stocks reaching their highest and lowest prices.
ATAIMS stock is 3.85% volatile and has beta coefficient of 1.09. Track ATA IMS BERHAD stock price on the chart and check out the list of the most volatile stocks — is ATA IMS BERHAD there?
Today ATA IMS BERHAD has the market capitalization of 312.74 M, it has decreased by −5.45% over the last week.
Yes, you can track ATA IMS BERHAD financials in yearly and quarterly reports right on TradingView.
ATA IMS BERHAD is going to release the next earnings report on Sep 2, 2025. Keep track of upcoming events with our Earnings Calendar.
ATAIMS net income for the last quarter is 26.81 M MYR, while the quarter before that showed 561.00 K MYR of net income which accounts for 4.68 K% change. Track more ATA IMS BERHAD financial stats to get the full picture.
EBITDA measures a company's operating performance, its growth signifies an improvement in the efficiency of a company. ATA IMS BERHAD EBITDA is −16.53 M MYR, and current EBITDA margin is −6.02%. See more stats in ATA IMS BERHAD financial statements.
Like other stocks, ATAIMS shares are traded on stock exchanges, e.g. Nasdaq, Nyse, Euronext, and the easiest way to buy them is through an online stock broker. To do this, you need to open an account and follow a broker's procedures, then start trading. You can trade ATA IMS BERHAD stock right from TradingView charts — choose your broker and connect to your account.
Investing in stocks requires a comprehensive research: you should carefully study all the available data, e.g. company's financials, related news, and its technical analysis. So ATA IMS BERHAD technincal analysis shows the sell today, and its 1 week rating is sell. Since market conditions are prone to changes, it's worth looking a bit further into the future — according to the 1 month rating ATA IMS BERHAD stock shows the sell signal. See more of ATA IMS BERHAD technicals for a more comprehensive analysis.
If you're still not sure, try looking for inspiration in our curated watchlists.
If you're still not sure, try looking for inspiration in our curated watchlists.