A Breakout Signal!The price candlestick body closed above the MA20 line with the volume confirming the price significant movement.
The RSI index indicates a strong gain than the losses. Hence, align with the price spike uptrend movement.
MACD and OBV indicate an uptrend divergence pattern and align with the price m
−0.025 MYR
1.86 M MYR
128.36 M MYR
422.44 M
About CHEETAH HOLDINGS BHD
Sector
Industry
Website
Headquarters
Seri Kembangan
Founded
1977
ISIN
MYL7209OO009
FIGI
BBG000BSS5G6
Cheetah Holdings Bhd. engages in the provision of product designing, product development, marketing, and retailing of sports apparel and accessories. Its brands include Cheeta Sports, C2 United, CTH Unlimited, GQ, Cheetah Ladies, C. Union, Arissa, Cheetah Junior, Baby Cheetah, and Ladybird Kids. The company was founded in 1977 and is headquartered in Seri Kembangan, Malaysia.
Related stocks

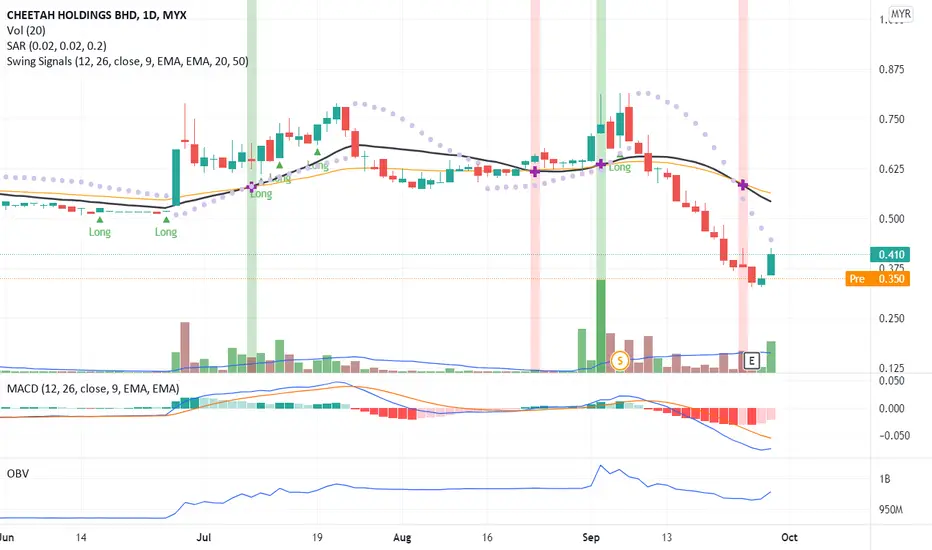
A Reversal Signal!The candlestick shows a significant price movement from previous traded. Hence a Reversal Signal. OBV chart shows a divergence signal but MACD chart is still in a negative pattern since MACD not yet crosses up signal line. A confirmation uptrend pattern is when MACD and OBV charts show a divergence
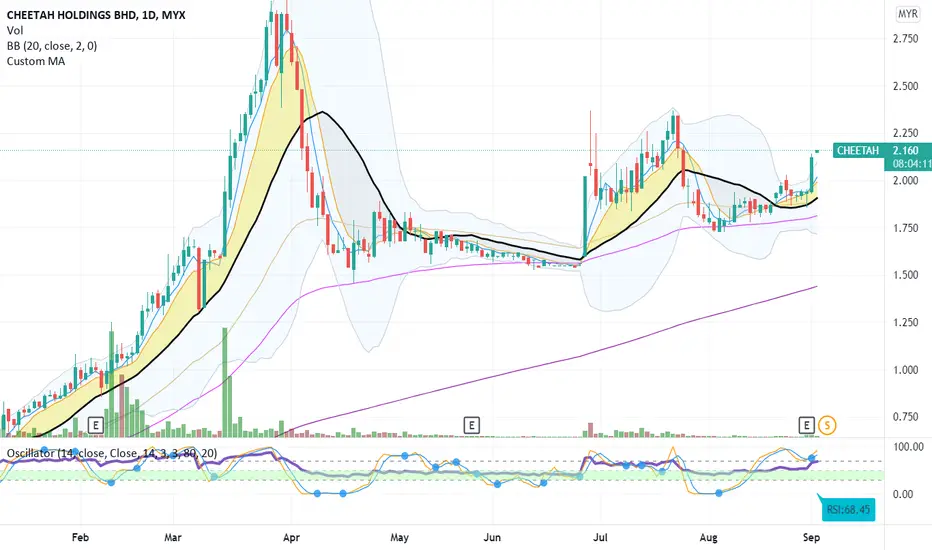
Is CHEETAH in Rally Up?Significant price movement makes CHEETAH Break-Out (BO) from Bollinger band with lesser volume support the increase compared to the previous trade day. The Bollinger band chart showing an uptrend pattern. Will it be able to hit the next resistance at 2.34? Let see CHEETAH performance on Friday.
CHEETAH - History repeat itself???MYX:CHEETAH
Today, there is a cross between the green and red lines (referring to EPRAF), a sign of the beginning of the uptrend phase.
Is CHEETAH going to start repeating its history ???

Swing Trategy TAVASector: Consumer Products & Services
Swing entry will appear after recent SS. Wait for entry once current price above both EMAs crossing.
RRR: 1:1
Disclaimer:
You should not engage in trading unless you fully understand the nature of the transactions you are entering into and the extent of you


See all ideas
Summarizing what the indicators are suggesting.
Oscillators
Neutral
SellBuy
Strong sellStrong buy
Strong sellSellNeutralBuyStrong buy
Oscillators
Neutral
SellBuy
Strong sellStrong buy
Strong sellSellNeutralBuyStrong buy
Summary
Neutral
SellBuy
Strong sellStrong buy
Strong sellSellNeutralBuyStrong buy
Summary
Neutral
SellBuy
Strong sellStrong buy
Strong sellSellNeutralBuyStrong buy
Summary
Neutral
SellBuy
Strong sellStrong buy
Strong sellSellNeutralBuyStrong buy
Moving Averages
Neutral
SellBuy
Strong sellStrong buy
Strong sellSellNeutralBuyStrong buy
Moving Averages
Neutral
SellBuy
Strong sellStrong buy
Strong sellSellNeutralBuyStrong buy
Displays a symbol's price movements over previous years to identify recurring trends.
Frequently Asked Questions
The current price of CHEETAH is 0.085 MYR — it has decreased by −5.56% in the past 24 hours. Watch CHEETAH HOLDINGS BHD stock price performance more closely on the chart.
Depending on the exchange, the stock ticker may vary. For instance, on MYX exchange CHEETAH HOLDINGS BHD stocks are traded under the ticker CHEETAH.
CHEETAH stock has fallen by −10.53% compared to the previous week, the month change is a −22.73% fall, over the last year CHEETAH HOLDINGS BHD has showed a −43.33% decrease.
CHEETAH reached its all-time high on Mar 31, 2021 with the price of 0.995 MYR, and its all-time low was 0.035 MYR and was reached on Nov 22, 2005. View more price dynamics on CHEETAH chart.
See other stocks reaching their highest and lowest prices.
See other stocks reaching their highest and lowest prices.
CHEETAH stock is 28.57% volatile and has beta coefficient of 0.92. Track CHEETAH HOLDINGS BHD stock price on the chart and check out the list of the most volatile stocks — is CHEETAH HOLDINGS BHD there?
Today CHEETAH HOLDINGS BHD has the market capitalization of 41.33 M, it has decreased by −5.26% over the last week.
Yes, you can track CHEETAH HOLDINGS BHD financials in yearly and quarterly reports right on TradingView.
CHEETAH net income for the last quarter is 2.22 M MYR, while the quarter before that showed −2.35 M MYR of net income which accounts for 194.80% change. Track more CHEETAH HOLDINGS BHD financial stats to get the full picture.
As of Jun 21, 2025, the company has 859 employees. See our rating of the largest employees — is CHEETAH HOLDINGS BHD on this list?
EBITDA measures a company's operating performance, its growth signifies an improvement in the efficiency of a company. CHEETAH HOLDINGS BHD EBITDA is 5.99 M MYR, and current EBITDA margin is 6.06%. See more stats in CHEETAH HOLDINGS BHD financial statements.
Like other stocks, CHEETAH shares are traded on stock exchanges, e.g. Nasdaq, Nyse, Euronext, and the easiest way to buy them is through an online stock broker. To do this, you need to open an account and follow a broker's procedures, then start trading. You can trade CHEETAH HOLDINGS BHD stock right from TradingView charts — choose your broker and connect to your account.
Investing in stocks requires a comprehensive research: you should carefully study all the available data, e.g. company's financials, related news, and its technical analysis. So CHEETAH HOLDINGS BHD technincal analysis shows the strong sell today, and its 1 week rating is strong sell. Since market conditions are prone to changes, it's worth looking a bit further into the future — according to the 1 month rating CHEETAH HOLDINGS BHD stock shows the strong sell signal. See more of CHEETAH HOLDINGS BHD technicals for a more comprehensive analysis.
If you're still not sure, try looking for inspiration in our curated watchlists.
If you're still not sure, try looking for inspiration in our curated watchlists.