10/6/25 Bear Bar Below 20-Day EMA or Outside Bull Bar?
Monday’s candlestick (Jun 9) was a small bear doji.
In our last report, we said traders would see if the bulls could create a bull entry bar testing near the Jun 3 high area, or if the bears would get another attempt to close below the 20-day EMA.
The market traded above Friday's high but the

5/6/25 Bulls Need To Create Strong Bull Bars, No FT Selling Yet
Wednesday’s candlestick (Jun 4) was a bear bar doji closing in its upper half with a long tail below.
In our last report, we said traders would see if the bulls could continue to create follow-through buying above the 20-day EMA, or if the bears would be able to develop bear bars trading back b
13/6/25 Can Bears Create Bear Bars or Stall Again?
Thursday’s candlestick (Jun 12) was a doji bar closing in its lower half with a long tail below.
In our last report, we said traders would see if the bears could create another follow-through bear bar, or if the market would stall and form a bull bar trading above the 20-day EMA in the next few

12/6/25 Can Bears Create More FT Selling or Stall?
Wednesday’s candlestick (Jun 11) was a bear bar closing below the middle of its range with a prominent tail below.
In our last report, we said traders would see if the bears can create a follow-through bear bar, or if the bulls could create a bull bar closing above the 20-day EMA.
The market f

11/6/26 Close Below 20-day EMA, Bears Need FT Selling
Tuesday’s candlestick (Jun 10) was a decent-sized bear closing near its low and below the 20-day EMA.
In our last report, we said traders would see if the bears can maintain the candlestick as a bear bar, or if the bulls could create a reversal to close the day as an outside bull bar.
The mark

9/6/5 20-Day EMA Holding as Support So Far
Friday’s candlestick (Jun 6) was a doji bar closing slightly above the middle of its range.
In our last report, we said traders would see if the bears could create a follow-through bear bar closing below the 20-day EMA, or if the bulls could create a bull bar reversing higher instead like June

FCPO Week 24 2025: Bullish.I'm expecting price to break 4000 next. If not then it will continue in consolidation mode. There is a little resistance at 4000 level but price should have enough to move higher to possible even touch 4200. Happy trading.

6/6/25 - FT Bear Bar or No FT Selling like Jun 3?
Thursday’s candlestick (Jun 5) was a bear bar closing near its low with a small tail below.
In our last report, we said traders would see if the bulls could continue to create follow-through buying above the 20-day EMA, or if the bears would be able to develop bear bars trading back below the 2

3/6/25 Surprise Gap Up, Bulls Need Follow-through Buying
Tuesday’s candlestick (Jun 3) was a bear bar doji closing in its lower half with a long tail above.
In our last report, we said traders would see if the bears could create a follow-through bear bar, or if the market would trade slightly lower, but close with a long tail below or with a bull bod

FCPO WEEK 23 2025: Bullish Potential.Price hold support steadily even though still failed to make any move higher. It seems that 3700 is a support area for now. There are two possibilities this week:
#1 - We might see consolidation this week and price might move sideways.
#2 - Price to retrace a bit and then make a breakout towards 400

See all ideas
Summarizing what the indicators are suggesting.
Neutral
SellBuy
Strong sellStrong buy
Strong sellSellNeutralBuyStrong buy
Neutral
SellBuy
Strong sellStrong buy
Strong sellSellNeutralBuyStrong buy
Neutral
SellBuy
Strong sellStrong buy
Strong sellSellNeutralBuyStrong buy
A representation of what an asset is worth today and what the market thinks it will be worth in the future.
Displays a symbol's price movements over previous years to identify recurring trends.
Related commodities
Frequently Asked Questions
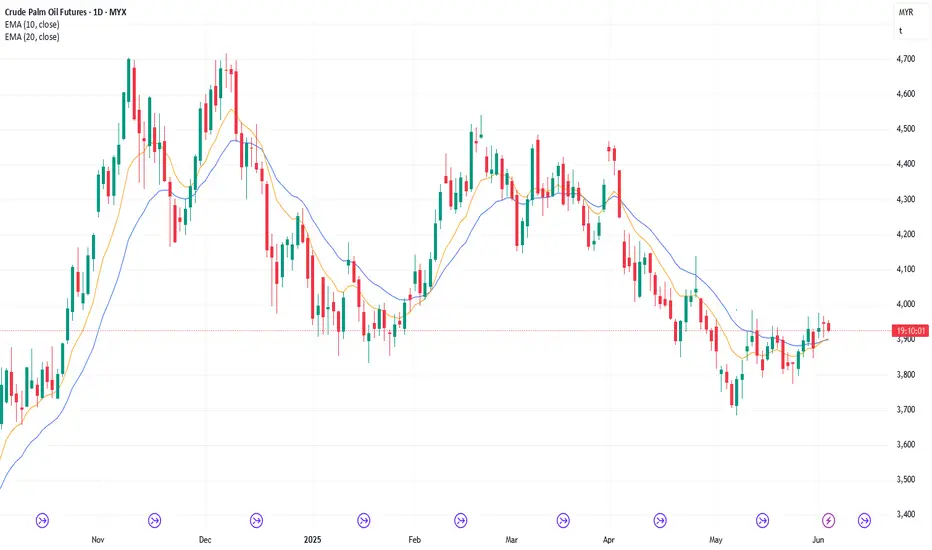
The current price of Crude Palm Oil Futures is 3,847 MYR / TNE — it has fallen −0.77% in the past 24 hours. Watch Crude Palm Oil Futures price in more detail on the chart.
The volume of Crude Palm Oil Futures is 41.00. Track more important stats on the Crude Palm Oil Futures chart.
The nearest expiration date for Crude Palm Oil Futures is Jun 13, 2025.
Traders prefer to sell futures contracts when they've already made money on the investment, but still have plenty of time left before the expiration date. Thus, many consider it a good option to sell Crude Palm Oil Futures before Jun 13, 2025.
Open interest is the number of contracts held by traders in active positions — they're not closed or expired. For Crude Palm Oil Futures this number is 1.99 K. You can use it to track a prevailing market trend and adjust your own strategy: declining open interest for Crude Palm Oil Futures shows that traders are closing their positions, which means a weakening trend.
Buying or selling futures contracts depends on many factors: season, underlying commodity, your own trading strategy. So mostly it's up to you, but if you look for some certain calculations to take into account, you can study technical analysis for Crude Palm Oil Futures. Today its technical rating is sell, but remember that market conditions change all the time, so it's always crucial to do your own research. See more of Crude Palm Oil Futures technicals for a more comprehensive analysis.