Next report date
—
Report period
—
EPS estimate
—
Revenue estimate
—
0.21 MYR
128.87 M MYR
1.02 B MYR
341.98 M
About JAYA TIASA HOLDINGS BHD
Sector
Industry
CEO
Kee Mou Jin
Website
Headquarters
Sibu
Founded
1960
ISIN
MYL4383OO005
FIGI
BBG000BDX1Z1
Jaya Tiasa Holdings Bhd. is an investment company, which engages in the provision of management services, extraction, and sale of logs. It operates through the following segments: Oil Palm, Oil Mill, Logs Trading, Manufacturing, and Others. The Oil Palm segment is involved in the development of oil palm plantations. The Oil Mill segment focuses on palm oil processing. The Logs Trading segment includes extraction and sales of logs, and development of planted forests. The Manufacturing segment supplies sawn timber, plywood, veneer, block board, and laminated wood. The Others segment provides air transportation services, fabrication and workshop services, and investment holding. The company was founded on April 1, 1960 and is headquartered in Sibu, Malaysia.
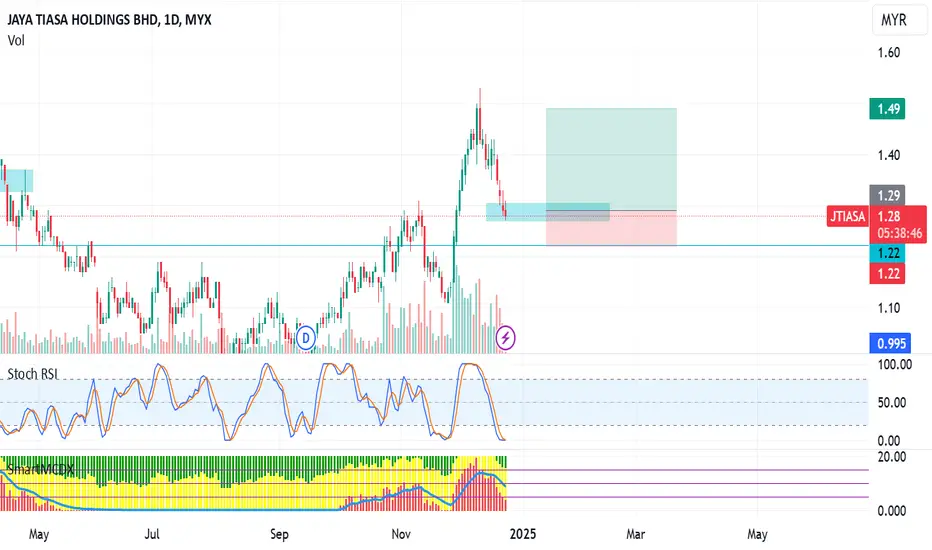
JTIASA - Looking for strong bullish continuationEntry & exit strategy setup.
Watch for pullback until entry zone Fib line 0.382 - 0.5.
Strong resistance at 1.33.
The price is well above the Kumo, indicating a strong bullish trend.
The Tenkan-sen is above the Kijun-sen, confirming bullish momentum.
The Chikou Span is above the price, indicating no


JTIASA, Uptrend based on AlgoSignal StrategyThe current point exhibits promising upward signals according to my algorithmic system, meeting various criteria. These include rising trading volume, an upward trend indicated by prices above EMA20 and EMA50, and the closing price surpassing VWAP. As a result, the present conditions suggest a poten


JTIASA. Palm Oil Related Stocks. 28/Nov/?23JTIASA, which business involved mostly on palm oil, just completed wave 2 ( Red Circled ) as a base for rally.

Usage of OBV and Divergence1. Example of powerful tools of PVA Analysis.
2. The analysis that can be done are :
a) Price making higher high but not followed by volume
b) An inverted hammer is formed with high volume (shown selling off by market maker)
c) A bearish divergence in RSI
d) A bearish divergence in OVB
3. All of


Double Top Chart Patterns for JTIASAIn the chart, we can see that two peaks or “tops” were formed after a strong move up.
Notice how the second top was not able to break the high of the first top. This is a strong sign that a reversal is going to occur because it is telling us that the buying pressure is just about finished.
With th

VCP SETUP JTIASAIncreasing EPS QOQ for 3 quarters consecutively and YOY.Price just breaks the horizontal line with higher than average volume

See all ideas
Summarizing what the indicators are suggesting.
Neutral
SellBuy
Strong sellStrong buy
Strong sellSellNeutralBuyStrong buy
Neutral
SellBuy
Strong sellStrong buy
Strong sellSellNeutralBuyStrong buy
Neutral
SellBuy
Strong sellStrong buy
Strong sellSellNeutralBuyStrong buy
An aggregate view of professional's ratings.
Neutral
SellBuy
Strong sellStrong buy
Strong sellSellNeutralBuyStrong buy
Neutral
SellBuy
Strong sellStrong buy
Strong sellSellNeutralBuyStrong buy
Neutral
SellBuy
Strong sellStrong buy
Strong sellSellNeutralBuyStrong buy
Displays a symbol's price movements over previous years to identify recurring trends.
Related stocks
Frequently Asked Questions
The current price of JTIASA is 1.06 MYR — it has decreased by −0.93% in the past 24 hours. Watch JAYA TIASA HOLDINGS BHD stock price performance more closely on the chart.
Depending on the exchange, the stock ticker may vary. For instance, on MYX exchange JAYA TIASA HOLDINGS BHD stocks are traded under the ticker JTIASA.
JTIASA stock has risen by 0.94% compared to the previous week, the month change is a −7.76% fall, over the last year JAYA TIASA HOLDINGS BHD has showed a −3.64% decrease.
We've gathered analysts' opinions on JAYA TIASA HOLDINGS BHD future price: according to them, JTIASA price has a max estimate of 1.50 MYR and a min estimate of 1.50 MYR. Watch JTIASA chart and read a more detailed JAYA TIASA HOLDINGS BHD stock forecast: see what analysts think of JAYA TIASA HOLDINGS BHD and suggest that you do with its stocks.
JTIASA reached its all-time high on Apr 20, 2012 with the price of 3.38 MYR, and its all-time low was 0.27 MYR and was reached on Mar 19, 2020. View more price dynamics on JTIASA chart.
See other stocks reaching their highest and lowest prices.
See other stocks reaching their highest and lowest prices.
JTIASA stock is 2.86% volatile and has beta coefficient of 1.45. Track JAYA TIASA HOLDINGS BHD stock price on the chart and check out the list of the most volatile stocks — is JAYA TIASA HOLDINGS BHD there?
Today JAYA TIASA HOLDINGS BHD has the market capitalization of 1.05 B, it has increased by 2.83% over the last week.
Yes, you can track JAYA TIASA HOLDINGS BHD financials in yearly and quarterly reports right on TradingView.
JAYA TIASA HOLDINGS BHD is going to release the next earnings report on Aug 27, 2025. Keep track of upcoming events with our Earnings Calendar.
JTIASA net income for the last quarter is 40.93 M MYR, while the quarter before that showed 74.53 M MYR of net income which accounts for −45.08% change. Track more JAYA TIASA HOLDINGS BHD financial stats to get the full picture.
JAYA TIASA HOLDINGS BHD dividend yield was 6.02% in 2024, and payout ratio reached 48.84%. The year before the numbers were 6.09% and 26.79% correspondingly. See high-dividend stocks and find more opportunities for your portfolio.
EBITDA measures a company's operating performance, its growth signifies an improvement in the efficiency of a company. JAYA TIASA HOLDINGS BHD EBITDA is 428.65 M MYR, and current EBITDA margin is 38.70%. See more stats in JAYA TIASA HOLDINGS BHD financial statements.
Like other stocks, JTIASA shares are traded on stock exchanges, e.g. Nasdaq, Nyse, Euronext, and the easiest way to buy them is through an online stock broker. To do this, you need to open an account and follow a broker's procedures, then start trading. You can trade JAYA TIASA HOLDINGS BHD stock right from TradingView charts — choose your broker and connect to your account.
Investing in stocks requires a comprehensive research: you should carefully study all the available data, e.g. company's financials, related news, and its technical analysis. So JAYA TIASA HOLDINGS BHD technincal analysis shows the strong sell today, and its 1 week rating is sell. Since market conditions are prone to changes, it's worth looking a bit further into the future — according to the 1 month rating JAYA TIASA HOLDINGS BHD stock shows the sell signal. See more of JAYA TIASA HOLDINGS BHD technicals for a more comprehensive analysis.
If you're still not sure, try looking for inspiration in our curated watchlists.
If you're still not sure, try looking for inspiration in our curated watchlists.