<TradeVSA> The GAME is OVER for Pasukhas ?Sign of Weakness in the chart:
1. Climatic Volume on Upbar
2. Huge Distribution with Up-Thrust and Sell-Off
3. Confirmation on Weakness in Hourly Chart
Case Study:
1. Asdion
2. Macpie
3. MMAG
Disclaimer
This information only serves as reference information and does not constitute a buy or sell ca
−0.105 MYR
−16.94 M MYR
74.75 M MYR
181.01 M
About PASUKHAS GROUP BERHAD
Sector
Industry
Website
Headquarters
Petaling Jaya
Founded
2005
ISIN
MYQ0177OO004
FIGI
BBG0038DXLS3
Pasukhas Group Bhd. is an investment holding company, which engages in the provision of mechanical and electrical engineering services. It operates through following segments: Mechanical and Electrical Engineering Services, (M&E) Manufacturing of LV Switchboards, Trading, Property Development (PD), Renewable Energy (RE), and Rental Property (RP). The M&E segment includes water treatment and sewerage industry, palm oil, sugar mills, refineries, and other factories. The Manufacturing of LV Switchboards segment involves in the sub-distribution for the generation, transmission, distribution, and conversion of electric energy and for the control of equipment that consume electric energy. The Trading segment offers a variety of goods without any particular specialization. The PD segment consists of civil engineering and construction. The RE segment comprises power plant and electricity supplied. The RP segment refers to the rental income generated from investment properties. The company was founded on March 29, 2005 and is headquartered in Petaling Jaya, Malaysia.
Related stocks

Ascending Channel PASUKGBTechnically in 30m TF show price action in Ascending Channel.
Within an ascending channel, price does not always remain entirely contained within the pattern’s parallel lines but instead shows areas of support and resistance that can use to set stop-loss orders and profit targets.
If price closed

Trends of PASUKGB** No buy/sell call **
** Solely for education purpose only **
1. looking the trends which moving above MA20 and upper band of MACD which is good signed and having some strength of pricing movement
2. however, the volume is getting lesser but price is increasing. this causing the gap in between get

PASUKGBPP has been completed at cost of 0.062.
Current price ranging from 0.07-0.075
R1: 0.0.9
R2: 0.125
Just an idea not a buy call. For education purpose.

PRIVATE PLACEMENT AND ESOS COMING (FLYYYYY)I show you
Support
Resistance
Trendline
EMA
MACD
RSI
Fibonacci Retracement
Gann Square of Nine

23/9/2020 PASUKGB - Testing strong support1. Gap up on 1st Sep followed by higher price with high volume on the next day made the 0.08-0.085 area a strong support.
2. Coincidentally, daily EMA50 line is also now at 0.085 area make it one of highly congested area.
Scenario 1 : The price will testing support before bounce back (BULLISH)
Sc

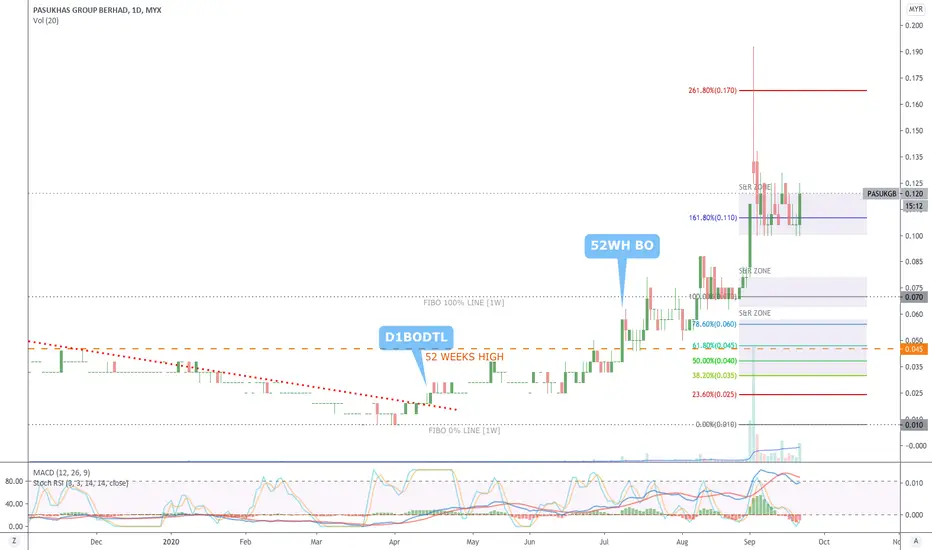
PASUKGB [22 September 2020] Strategy: Buy On Resistant Zone BreaMYX:PASUKGB
Breakout Downtrend Line
52 Weeks High Line
Fibbonaci Retracement
Candlestick Support & Resistant Zone
Trendline Support & Resistant
PASUKGB saja bagi trader lain panic ke ?Penemuan pattern harmonic didalam, menunjukkan price masih boleh kearah atas sebelum membuat reversal kebawah.
Mungkin kepada yang dah hold boleh consider untuk TP kat bawah level fibo hijau diatas.
Manakala yang belum hold mungkin boleh consider untuk sauk kat level biru dibawah bila harga dah bu

PASUKGB MSR
EP : 0.065
CL : 0.055
S : 0.060
R1 : 0.070
R2 : 0.080
PENNY Counter
Market Capital (RM) : 52.94m

See all ideas
Summarizing what the indicators are suggesting.
Oscillators
Neutral
SellBuy
Strong sellStrong buy
Strong sellSellNeutralBuyStrong buy
Oscillators
Neutral
SellBuy
Strong sellStrong buy
Strong sellSellNeutralBuyStrong buy
Summary
Neutral
SellBuy
Strong sellStrong buy
Strong sellSellNeutralBuyStrong buy
Summary
Neutral
SellBuy
Strong sellStrong buy
Strong sellSellNeutralBuyStrong buy
Summary
Neutral
SellBuy
Strong sellStrong buy
Strong sellSellNeutralBuyStrong buy
Moving Averages
Neutral
SellBuy
Strong sellStrong buy
Strong sellSellNeutralBuyStrong buy
Moving Averages
Neutral
SellBuy
Strong sellStrong buy
Strong sellSellNeutralBuyStrong buy
Displays a symbol's price movements over previous years to identify recurring trends.
Frequently Asked Questions
The current price of PASUKGB is 0.055 MYR — it hasn't changed in the past 24 hours. Watch PASUKHAS GROUP BERHAD stock price performance more closely on the chart.
Depending on the exchange, the stock ticker may vary. For instance, on MYX exchange PASUKHAS GROUP BERHAD stocks are traded under the ticker PASUKGB.
PASUKGB stock hasn't changed in a week, the last month showed zero change in price, over the last year PASUKHAS GROUP BERHAD has showed a −65.63% decrease.
PASUKGB reached its all-time high on Aug 30, 2012 with the price of 34.775 MYR, and its all-time low was 0.050 MYR and was reached on Jun 19, 2025. View more price dynamics on PASUKGB chart.
See other stocks reaching their highest and lowest prices.
See other stocks reaching their highest and lowest prices.
PASUKGB stock is 18.18% volatile and has beta coefficient of 0.81. Track PASUKHAS GROUP BERHAD stock price on the chart and check out the list of the most volatile stocks — is PASUKHAS GROUP BERHAD there?
Today PASUKHAS GROUP BERHAD has the market capitalization of 12.38 M, it has decreased by −14.29% over the last week.
Yes, you can track PASUKHAS GROUP BERHAD financials in yearly and quarterly reports right on TradingView.
PASUKGB net income for the last quarter is −5.89 M MYR, while the quarter before that showed −3.66 M MYR of net income which accounts for −61.02% change. Track more PASUKHAS GROUP BERHAD financial stats to get the full picture.
No, PASUKGB doesn't pay any dividends to its shareholders. But don't worry, we've prepared a list of high-dividend stocks for you.
EBITDA measures a company's operating performance, its growth signifies an improvement in the efficiency of a company. PASUKHAS GROUP BERHAD EBITDA is −13.47 M MYR, and current EBITDA margin is −17.93%. See more stats in PASUKHAS GROUP BERHAD financial statements.
Like other stocks, PASUKGB shares are traded on stock exchanges, e.g. Nasdaq, Nyse, Euronext, and the easiest way to buy them is through an online stock broker. To do this, you need to open an account and follow a broker's procedures, then start trading. You can trade PASUKHAS GROUP BERHAD stock right from TradingView charts — choose your broker and connect to your account.
Investing in stocks requires a comprehensive research: you should carefully study all the available data, e.g. company's financials, related news, and its technical analysis. So PASUKHAS GROUP BERHAD technincal analysis shows the strong sell today, and its 1 week rating is strong sell. Since market conditions are prone to changes, it's worth looking a bit further into the future — according to the 1 month rating PASUKHAS GROUP BERHAD stock shows the sell signal. See more of PASUKHAS GROUP BERHAD technicals for a more comprehensive analysis.
If you're still not sure, try looking for inspiration in our curated watchlists.
If you're still not sure, try looking for inspiration in our curated watchlists.