A Divergent Signal!The candlestick indicates a divergence signal where the price closed above the MA line compared with previous candlesticks without significant results in volume. Therefore, an attempt to push the price towards next price peak resistance with low volume.
MACD and RSI indicators indicate a positive t
Next report date
—
Report period
—
EPS estimate
—
Revenue estimate
—
0.020 MYR
8.99 M MYR
54.57 M MYR
104.17 M
About UMEDIC GROUP BERHAD
Sector
Industry
CEO
Taw Seong Lim
Website
Headquarters
Bandar Cassia
Founded
2002
ISIN
MYQ0256OO006
FIGI
BBG018NCXKM4
UMediC Group Bhd. is an investment holding company, which engages in the marketing, distribution, and manufacturing of medical devices and consumables. It operates through the Marketing and Distribution and Manufacturing segments. The Marketing and Distribution segment distributes medical devices as well as the provision of after-sales service. The Manufacturing segment develops and manufactures medical devices. The company was founded in 2002 and is headquartered in Bandar Cassia, Malaysia.
Related stocks

UMC - Looking for support Potential for rebound?
>> Hull MA still red
>> Still trade under red blue sea
>> still OS counter.
Look for potential ladder for safer trade.
Bottom Parallel Channel's line as support.
Disclaimer: Mentioned stocks are solely based on own opinions for education and/or discussion purpose only.
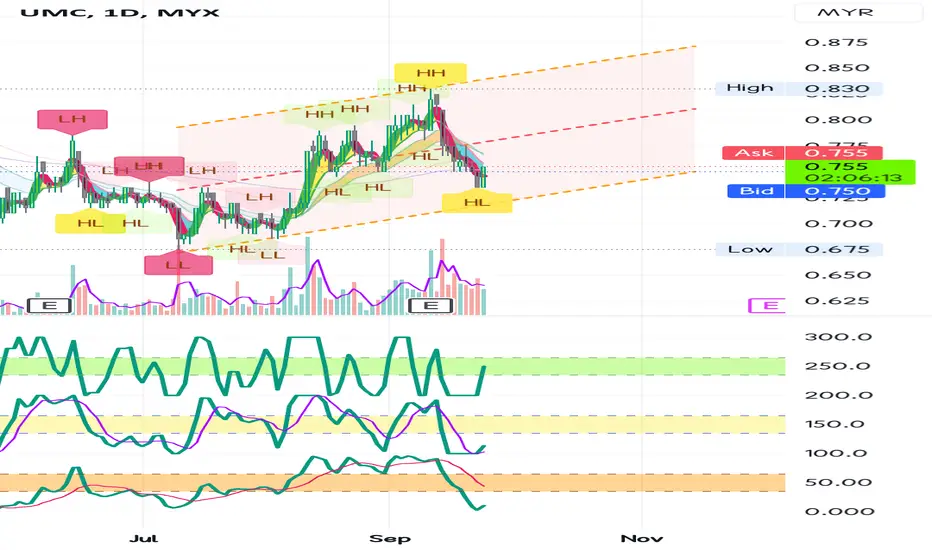
UMC going to breakout testing 4th time of RJust for reference no call buy. Let see how it's going on ...
R - 0.905
S - 0.780
TP 1.20

See all ideas
Summarizing what the indicators are suggesting.
Neutral
SellBuy
Strong sellStrong buy
Strong sellSellNeutralBuyStrong buy
Neutral
SellBuy
Strong sellStrong buy
Strong sellSellNeutralBuyStrong buy
Neutral
SellBuy
Strong sellStrong buy
Strong sellSellNeutralBuyStrong buy
An aggregate view of professional's ratings.
Neutral
SellBuy
Strong sellStrong buy
Strong sellSellNeutralBuyStrong buy
Neutral
SellBuy
Strong sellStrong buy
Strong sellSellNeutralBuyStrong buy
Neutral
SellBuy
Strong sellStrong buy
Strong sellSellNeutralBuyStrong buy
Displays a symbol's price movements over previous years to identify recurring trends.
Frequently Asked Questions
The current price of UMC is 0.380 MYR — it has decreased by −5.06% in the past 24 hours. Watch UMEDIC GROUP BERHAD stock price performance more closely on the chart.
Depending on the exchange, the stock ticker may vary. For instance, on MYX exchange UMEDIC GROUP BERHAD stocks are traded under the ticker UMC.
UMC stock has fallen by −6.25% compared to the previous week, the month change is a −6.25% fall, over the last year UMEDIC GROUP BERHAD has showed a −45.71% decrease.
We've gathered analysts' opinions on UMEDIC GROUP BERHAD future price: according to them, UMC price has a max estimate of 0.45 MYR and a min estimate of 0.40 MYR. Watch UMC chart and read a more detailed UMEDIC GROUP BERHAD stock forecast: see what analysts think of UMEDIC GROUP BERHAD and suggest that you do with its stocks.
UMC stock is 4.11% volatile and has beta coefficient of 0.83. Track UMEDIC GROUP BERHAD stock price on the chart and check out the list of the most volatile stocks — is UMEDIC GROUP BERHAD there?
Yes, you can track UMEDIC GROUP BERHAD financials in yearly and quarterly reports right on TradingView.
UMEDIC GROUP BERHAD is going to release the next earnings report on Sep 16, 2025. Keep track of upcoming events with our Earnings Calendar.
UMC net income for the last quarter is 1.89 M MYR, while the quarter before that showed 1.84 M MYR of net income which accounts for 2.49% change. Track more UMEDIC GROUP BERHAD financial stats to get the full picture.
No, UMC doesn't pay any dividends to its shareholders. But don't worry, we've prepared a list of high-dividend stocks for you.
As of Jun 20, 2025, the company has 165 employees. See our rating of the largest employees — is UMEDIC GROUP BERHAD on this list?
EBITDA measures a company's operating performance, its growth signifies an improvement in the efficiency of a company. UMEDIC GROUP BERHAD EBITDA is 12.37 M MYR, and current EBITDA margin is 25.13%. See more stats in UMEDIC GROUP BERHAD financial statements.
Like other stocks, UMC shares are traded on stock exchanges, e.g. Nasdaq, Nyse, Euronext, and the easiest way to buy them is through an online stock broker. To do this, you need to open an account and follow a broker's procedures, then start trading. You can trade UMEDIC GROUP BERHAD stock right from TradingView charts — choose your broker and connect to your account.
Investing in stocks requires a comprehensive research: you should carefully study all the available data, e.g. company's financials, related news, and its technical analysis. So UMEDIC GROUP BERHAD technincal analysis shows the sell today, and its 1 week rating is sell. Since market conditions are prone to changes, it's worth looking a bit further into the future — according to the 1 month rating UMEDIC GROUP BERHAD stock shows the sell signal. See more of UMEDIC GROUP BERHAD technicals for a more comprehensive analysis.
If you're still not sure, try looking for inspiration in our curated watchlists.
If you're still not sure, try looking for inspiration in our curated watchlists.