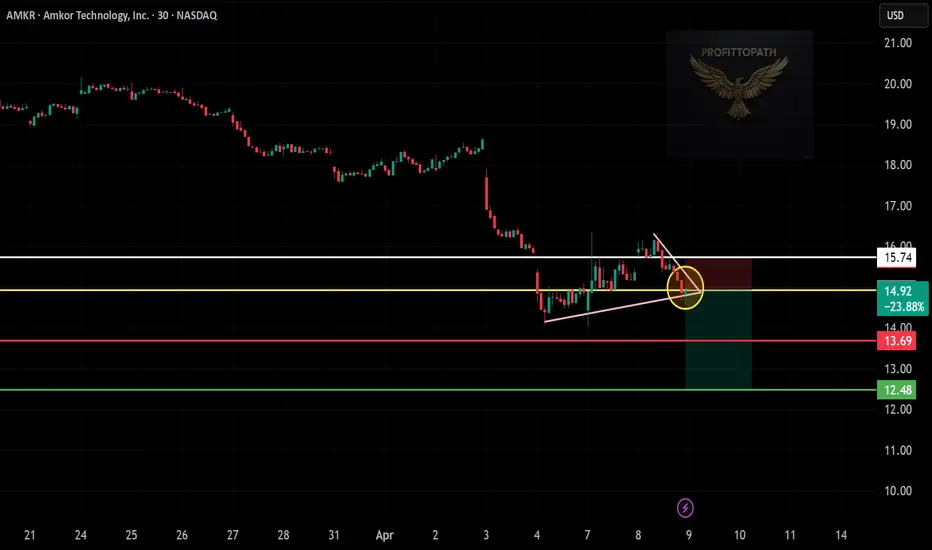
AMKR – 30-Min Short Trade Setup!📉 🔻
🔹 Asset: Amkor Technology, Inc. (AMKR – NASDAQ)
🔹 Timeframe: 30-Min Chart
🔹 Setup Type: Rising Wedge Breakdown + Retest Rejection
📊 Trade Plan (Short Position)
✅ Entry Zone: Below $14.90 (Confirmed Breakdown)
✅ Stop-Loss (SL): Above $15.74 (White resistance zone)
🎯 Take Profit Targets:
📌 TP1:
Next report date
—
Report period
—
EPS estimate
—
Revenue estimate
—
1.28 USD
354.01 M USD
6.32 B USD
99.88 M
About Amkor Technology, Inc.
Sector
Industry
CEO
Giel Rutten
Website
Headquarters
Tempe
Founded
1968
FIGI
BBG000BCKGW7
Amkor Technology, Inc. engages in the provision of outsourced semiconductor packaging and test services. Its services include design, package characterization, test, and wafer bumping services. The company was founded in 1968 and is headquartered in Tempe, AZ.
Can it gain a foothold in technology? $AMKRFounded in 1968 and headquartered in Tempe, Arizona. The company provides outsourced semiconductor packaging and testing services in the US, Japan, Europe, Middle East, Africa and Asia Pacific regions.
In 2023, Amkor's total revenue was $6.5 billion, a decrease of 8.3% from 2022. Its revenues have

💡 Amkor Technology ($AMKR) 💡 Amkor Technology ( NASDAQ:AMKR ) joins PHLX Semiconductor Sector Index (SOX), a top 30 US-listed semiconductor player! Q3 sales poised for all-time highs at $1.775B, a robust 22% QoQ surge. Strong balance sheet: $1.2B cash, outpacing $1.13B debt.
📈 Bullish outlook holds firm above $24.00-$25.00,

AMKR - Double Top Breaking CurveViewing the curved channel we can see that their is an evident double top formed within it.
This will likely break down and break this curve, which is standard for a double top pattern.
Bearish

AMKR - Amkor Technology, Inc.Top of my focus list going into the upcoming week. Growth numbers are good, increasing number of funds buying shares, earnings still two weeks away.
On a technical basis, a surge in volume took prices thru some key highs and now we're seeing an orderly consolidation with good looking volume pattern

AMKR - RETRACEMENTWave 5 is over.
AMKR needs rest . We would wait for Wave A completion to Bull.
Good luck

AMKR is a long term for me AMKR is showing a really strong upward trend on the daily and weekly chart. Today it has broken its daily resistance $24.92 - $25.74. I'm looking for a continuation of this uptrend. This will be a good Leap for me.

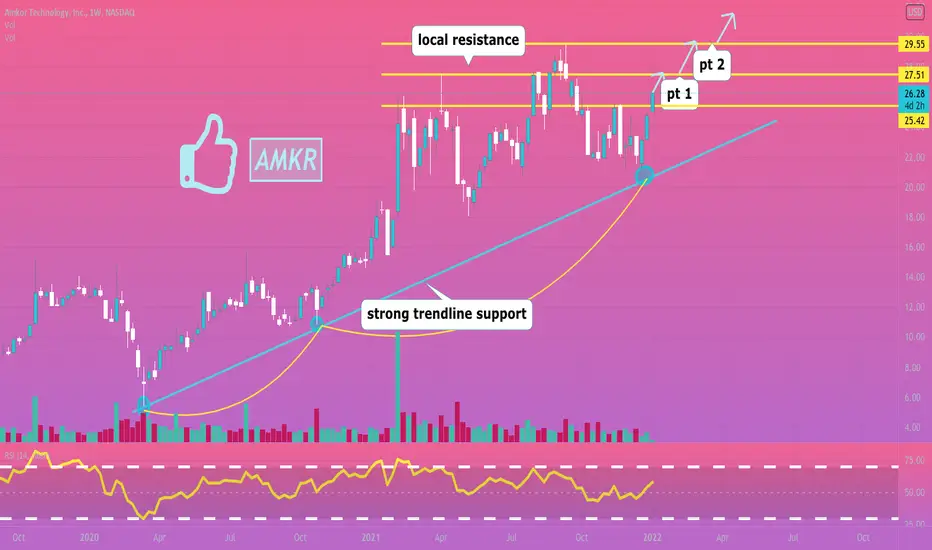
looking for continuation ✅amkr breaking 1/3 local resistance levels today, recently saw a perfect bounce off its strong trendline support.
all good signs for longs, we most likely see price targets 1-2 hit in the next few weeks. A all time high break should follow.
like and follow for more 💘
Amkor ABCA 50M
B 102M
C 78M
31thDec 6.1M...
Elliott Wave Theory, or ABC wave theory, is a term for three-wave counter trend price movement. Here, wave A is the first price wave that is against the trend of the entire market. B wave is a corrective wave for wave A. Wave C shows the final price move to com

Buy AMKR 21/10/2021You can buy AMKR target 27.04 stop loss 21.18
Money management your responsibility.
I recommend entering a maximum of 10% of the portfolio.
Good luck

See all ideas
Summarizing what the indicators are suggesting.
Neutral
SellBuy
Strong sellStrong buy
Strong sellSellNeutralBuyStrong buy
Neutral
SellBuy
Strong sellStrong buy
Strong sellSellNeutralBuyStrong buy
Neutral
SellBuy
Strong sellStrong buy
Strong sellSellNeutralBuyStrong buy
An aggregate view of professional's ratings.
Neutral
SellBuy
Strong sellStrong buy
Strong sellSellNeutralBuyStrong buy
Neutral
SellBuy
Strong sellStrong buy
Strong sellSellNeutralBuyStrong buy
Neutral
SellBuy
Strong sellStrong buy
Strong sellSellNeutralBuyStrong buy
Displays a symbol's price movements over previous years to identify recurring trends.
Related stocks
Frequently Asked Questions
The current price of AMKR is 20.36 USD — it has increased by 0.20% in the past 24 hours. Watch Amkor Technology, Inc. stock price performance more closely on the chart.
Depending on the exchange, the stock ticker may vary. For instance, on NASDAQ exchange Amkor Technology, Inc. stocks are traded under the ticker AMKR.
AMKR stock has fallen by −1.26% compared to the previous week, the month change is a 5.88% rise, over the last year Amkor Technology, Inc. has showed a −44.49% decrease.
We've gathered analysts' opinions on Amkor Technology, Inc. future price: according to them, AMKR price has a max estimate of 30.00 USD and a min estimate of 18.00 USD. Watch AMKR chart and read a more detailed Amkor Technology, Inc. stock forecast: see what analysts think of Amkor Technology, Inc. and suggest that you do with its stocks.
AMKR reached its all-time high on Mar 24, 2000 with the price of 65.31 USD, and its all-time low was 1.13 USD and was reached on Sep 24, 2002. View more price dynamics on AMKR chart.
See other stocks reaching their highest and lowest prices.
See other stocks reaching their highest and lowest prices.
AMKR stock is 2.04% volatile and has beta coefficient of 2.00. Track Amkor Technology, Inc. stock price on the chart and check out the list of the most volatile stocks — is Amkor Technology, Inc. there?
Yes, you can track Amkor Technology, Inc. financials in yearly and quarterly reports right on TradingView.
Amkor Technology, Inc. is going to release the next earnings report on Aug 4, 2025. Keep track of upcoming events with our Earnings Calendar.
AMKR earnings for the last quarter are 0.09 USD per share, whereas the estimation was 0.09 USD resulting in a 2.03% surprise. The estimated earnings for the next quarter are 0.16 USD per share. See more details about Amkor Technology, Inc. earnings.
Amkor Technology, Inc. revenue for the last quarter amounts to 1.32 B USD, despite the estimated figure of 1.28 B USD. In the next quarter, revenue is expected to reach 1.42 B USD.
AMKR net income for the last quarter is 21.13 M USD, while the quarter before that showed 105.65 M USD of net income which accounts for −80.00% change. Track more Amkor Technology, Inc. financial stats to get the full picture.
Yes, AMKR dividends are paid quarterly. The last dividend per share was 0.08 USD. As of today, Dividend Yield (TTM)% is 1.59%. Tracking Amkor Technology, Inc. dividends might help you take more informed decisions.
Amkor Technology, Inc. dividend yield was 1.24% in 2024, and payout ratio reached 22.33%. The year before the numbers were 0.91% and 20.87% correspondingly. See high-dividend stocks and find more opportunities for your portfolio.
As of Jun 20, 2025, the company has 28.3 K employees. See our rating of the largest employees — is Amkor Technology, Inc. on this list?
EBITDA measures a company's operating performance, its growth signifies an improvement in the efficiency of a company. Amkor Technology, Inc. EBITDA is 1.00 B USD, and current EBITDA margin is 16.35%. See more stats in Amkor Technology, Inc. financial statements.
Like other stocks, AMKR shares are traded on stock exchanges, e.g. Nasdaq, Nyse, Euronext, and the easiest way to buy them is through an online stock broker. To do this, you need to open an account and follow a broker's procedures, then start trading. You can trade Amkor Technology, Inc. stock right from TradingView charts — choose your broker and connect to your account.
Investing in stocks requires a comprehensive research: you should carefully study all the available data, e.g. company's financials, related news, and its technical analysis. So Amkor Technology, Inc. technincal analysis shows the buy rating today, and its 1 week rating is sell. Since market conditions are prone to changes, it's worth looking a bit further into the future — according to the 1 month rating Amkor Technology, Inc. stock shows the neutral signal. See more of Amkor Technology, Inc. technicals for a more comprehensive analysis.
If you're still not sure, try looking for inspiration in our curated watchlists.
If you're still not sure, try looking for inspiration in our curated watchlists.