GIGM DCA - Cup and Handle PatternCompany: GigaMedia Limited
Ticker: GIGM
Exchange: NASDAQ
Sector: Technology
Introduction:
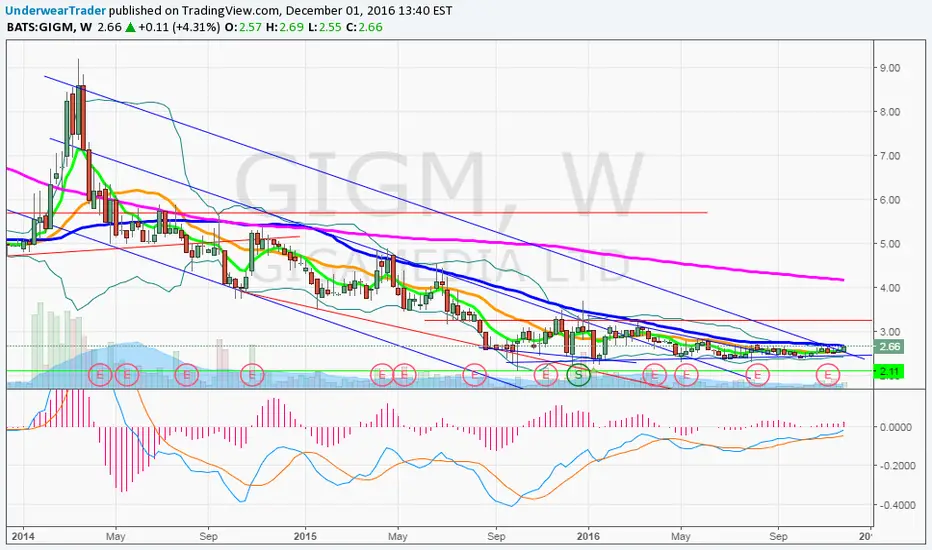
Hello everyone, today we are focusing on GigaMedia Limited (GIGM), analyzing its Daily scale chart on the NASDAQ exchange. The price chart has caught our attention due to the formation of a bottom pattern,
−0.19 USD
−2.30 M USD
2.97 M USD
6.02 M
About GigaMedia Limited
Sector
Industry
CEO
Cheng Ming Huang
Website
Headquarters
Taipei
Founded
1998
ISIN
SG9999014831
FIGI
BBG000BQGYG0
GigaMedia Ltd. is engaged in the provision of digital entertainment services. Through its subsidiary, FunTown, it manages mobile and browse-based casual games. Its portfolio includes MahJong, online card games, and multi-player role-playing online games. The company was founded in October 1998 and is headquartered in Taipei, Taiwan.
Related stocks

Falling Channel (USA Stock Reference)USA Stock Analysis: Gigamedia has broken the falling channel and supply zone with high volume, As long as price stays above the demand zone expected to reach the target mentioned on the chart. let's see
Happy Investing!

Silly graph of: GIGMI have been a long-time bagholder of this zombie, and it is starting to blink.
Recently inside trades last years.
Trades below book value.
Starting to operate within the RaaS industry.

Large insider buy by CEO - 7.5% target / 10% stop lossAverage volatility, last time when CEO bought big (December 2017) stock jumped nearly 50%

Big spike Volume Also known like unusual volume is a traditional way to pick stocks because something is happening here, somebody have a big interest here and he or they bought a big quantity of shares the same day and this generally drives the price up.
Other aspect to take into account is
Shares Outstanding: 11.0


See all ideas
Summarizing what the indicators are suggesting.
Oscillators
Neutral
SellBuy
Strong sellStrong buy
Strong sellSellNeutralBuyStrong buy
Oscillators
Neutral
SellBuy
Strong sellStrong buy
Strong sellSellNeutralBuyStrong buy
Summary
Neutral
SellBuy
Strong sellStrong buy
Strong sellSellNeutralBuyStrong buy
Summary
Neutral
SellBuy
Strong sellStrong buy
Strong sellSellNeutralBuyStrong buy
Summary
Neutral
SellBuy
Strong sellStrong buy
Strong sellSellNeutralBuyStrong buy
Moving Averages
Neutral
SellBuy
Strong sellStrong buy
Strong sellSellNeutralBuyStrong buy
Moving Averages
Neutral
SellBuy
Strong sellStrong buy
Strong sellSellNeutralBuyStrong buy
Displays a symbol's price movements over previous years to identify recurring trends.
Frequently Asked Questions
The current price of GIGM is 1.43 USD — it has decreased by −1.96% in the past 24 hours. Watch GigaMedia Limited stock price performance more closely on the chart.
Depending on the exchange, the stock ticker may vary. For instance, on NASDAQ exchange GigaMedia Limited stocks are traded under the ticker GIGM.
GIGM stock has risen by 1.30% compared to the previous week, the month change is a −0.12% fall, over the last year GigaMedia Limited has showed a 11.59% increase.
GIGM reached its all-time high on Mar 2, 2000 with the price of 455.00 USD, and its all-time low was 1.00 USD and was reached on Nov 11, 2002. View more price dynamics on GIGM chart.
See other stocks reaching their highest and lowest prices.
See other stocks reaching their highest and lowest prices.
GIGM stock is 2.92% volatile and has beta coefficient of 0.21. Track GigaMedia Limited stock price on the chart and check out the list of the most volatile stocks — is GigaMedia Limited there?
Today GigaMedia Limited has the market capitalization of 16.10 M, it has decreased by −1.37% over the last week.
Yes, you can track GigaMedia Limited financials in yearly and quarterly reports right on TradingView.
GIGM net income for the last quarter is −677.00 K USD, while the quarter before that showed −463.00 K USD of net income which accounts for −46.22% change. Track more GigaMedia Limited financial stats to get the full picture.
No, GIGM doesn't pay any dividends to its shareholders. But don't worry, we've prepared a list of high-dividend stocks for you.
As of Jul 30, 2025, the company has 87 employees. See our rating of the largest employees — is GigaMedia Limited on this list?
EBITDA measures a company's operating performance, its growth signifies an improvement in the efficiency of a company. GigaMedia Limited EBITDA is −3.50 M USD, and current EBITDA margin is −122.70%. See more stats in GigaMedia Limited financial statements.
Like other stocks, GIGM shares are traded on stock exchanges, e.g. Nasdaq, Nyse, Euronext, and the easiest way to buy them is through an online stock broker. To do this, you need to open an account and follow a broker's procedures, then start trading. You can trade GigaMedia Limited stock right from TradingView charts — choose your broker and connect to your account.
Investing in stocks requires a comprehensive research: you should carefully study all the available data, e.g. company's financials, related news, and its technical analysis. So GigaMedia Limited technincal analysis shows the sell today, and its 1 week rating is sell. Since market conditions are prone to changes, it's worth looking a bit further into the future — according to the 1 month rating GigaMedia Limited stock shows the sell signal. See more of GigaMedia Limited technicals for a more comprehensive analysis.
If you're still not sure, try looking for inspiration in our curated watchlists.
If you're still not sure, try looking for inspiration in our curated watchlists.