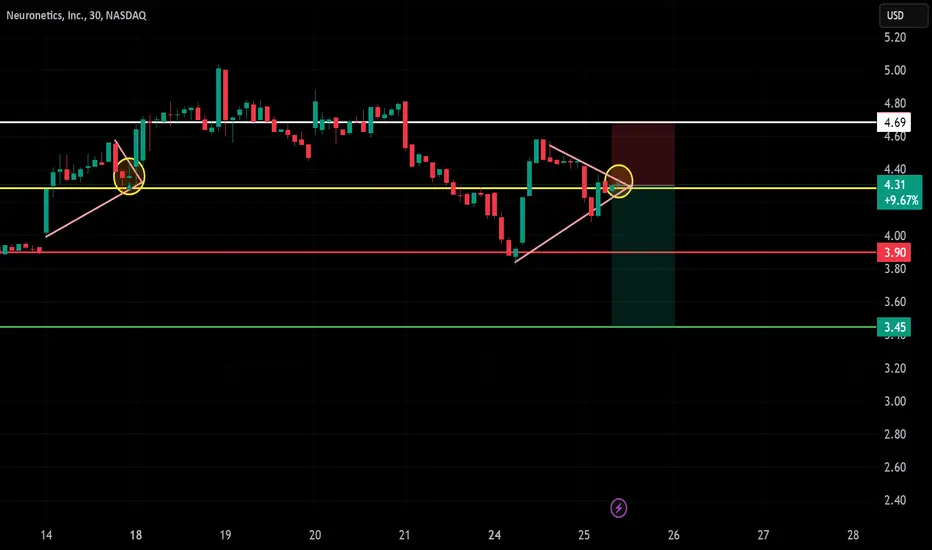
STIM/USD – 30-Min Short Trade Setup !📌📉
🔹 Asset: Neuronetics, Inc. (STIM/USD)
🔹 Timeframe: 30-Min Chart
🔹 Setup Type: Bearish Breakdown Trade
📌 Trade Plan (Short Position)
✅ Entry Zone: Below $4.29 (Breakdown Confirmation)
✅ Stop-Loss (SL): Above $4.69 (Break of Resistance & Trendline)
🎯 Take Profit Targets
📌 TP1: $3.90 (First Suppor
Next report date
—
Report period
—
EPS estimate
—
Revenue estimate
—
−1.31 USD
−43.71 M USD
74.89 M USD
36.77 M
About Neuronetics, Inc.
Sector
Industry
CEO
Keith J. Sullivan
Website
Headquarters
Malvern
Founded
1998
FIGI
BBG000QX36J1
Neuronetics, Inc. is a commercial stage medical technology company, which focuses on designing, developing, and marketing products that improve the quality of life for patients who suffer from neurohealth disorders. It operates through United States and International geographical segments. The company was founded by Steven B. Waite, Bruce J. Shook, Norman R. Weldon, and Thomas D. Weldon in 1998 and is headquartered in Malvern, PA.
Related stocks
Long Trade Setup Breakdown for Neuronetics, Inc. (STIM) - 30-Min📊
🔹 Asset: Neuronetics, Inc. (STIM)
🔹 Timeframe: 30-Min Chart
🔹 Setup Type: Ascending Triangle Breakout
🚀 Trade Plan (Long Position):
✅ Entry Zone: $4.35 (Breakout Confirmation)
✅ Stop-Loss (SL): $3.99 (Below Support)
🎯 Take Profit Targets (Long Trade):
📌 TP1: $4.76 (First Resistance)
📌 TP2: $5.

STIM Long Trade Setup (30-Min Chart) !🚀 📈🔥
🔍 Stock: STIM (NASDAQ)
⏳ Timeframe: 30-Min Chart
📈 Setup Type: Bullish Reversal
📍 Trade Plan:
✅ Entry Zone: $3.05 - $3.10 (Falling Wedge Breakout + Support)
🚀 Take Profit 1 (TP1): $3.41 (Key Resistance)
🚀 Take Profit 2 (TP2): $3.74+ (Extended Target if momentum continues)
🔻 Stop-Loss (SL): $2.8

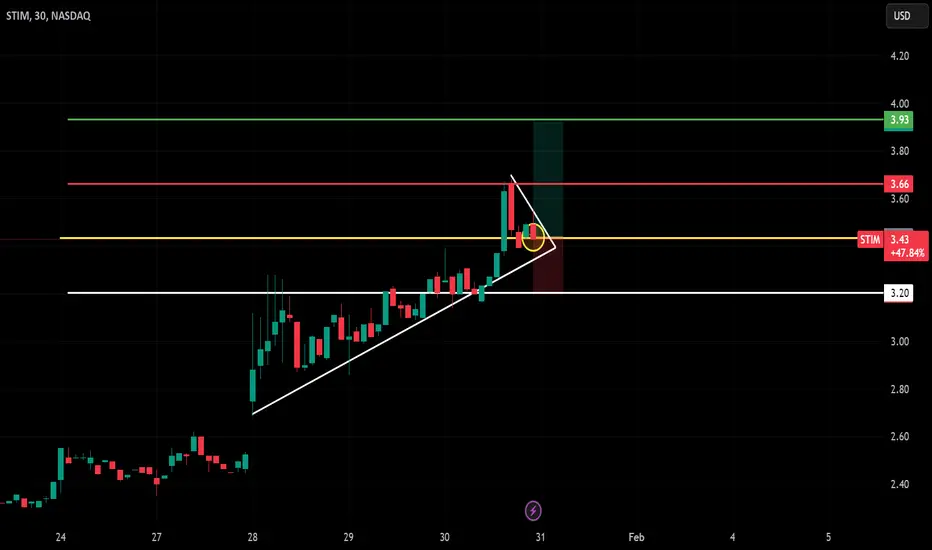
STIM Long Trade Setup (30-Min Chart)!🚀 📈🔥
🔍 Stock: STIM (NASDAQ)
⏳ Timeframe: 30-Min Chart
📈 Setup Type: Bullish Breakout
📍 Trade Plan:
✅ Entry: $3.43 (Breakout Confirmation)
❌ Stop-Loss (SL): $3.20 (Below support level for risk management)
🎯 Target 1: $3.66 (First Resistance Level)
🚀 Target 2: $3.93 (Major Resistance Level – Moon Sh
STIM to the moon?STIM brokeout of bull flag, there's a greater uptrend channel it could break into, good news catalyst recently as company promising FCF. only have a small position but it looks promising. I'm a rough TA hobbyist. Do your own analysis, NFA.

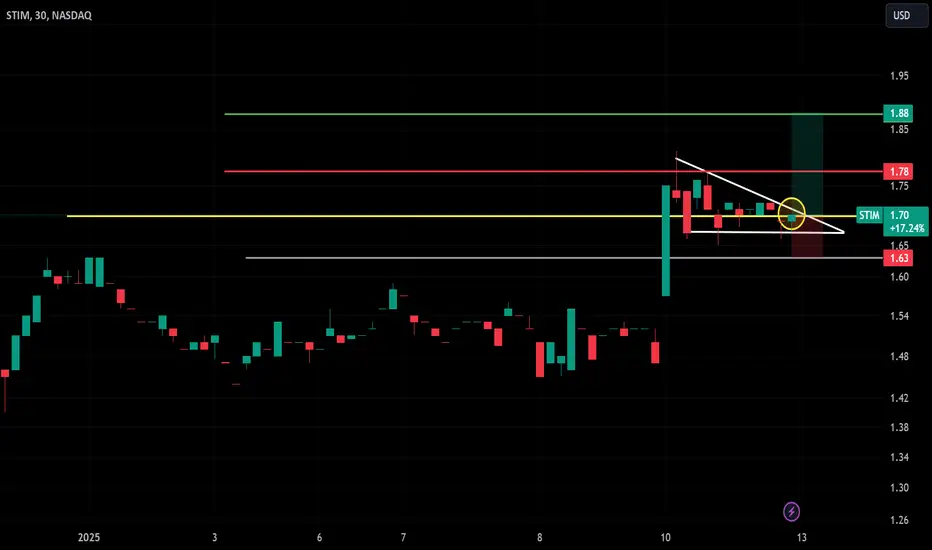
STIM Trade Idea: Entry, Stop Loss, and Target Analysis!Trade Details:
Entry: $1.70 (Breakout point at yellow level)
Stop Loss (SL): $1.63 (Below the consolidation support)
Target 1 (T1): $1.78 (Immediate resistance level)
Target 2 (T2): $1.88 (Major resistance zone above)
FDA Clearance for Treatment of Anxious DepressionSTIM: Neuronetics
2022-07-19 07:00:00
NeuroStar® Advanced Therapy for Mental Health Receives FDA Clearance for Treatment of Anxious Depression

STIM BullishI like the recent MACD cross and that the most recent candle tested two fib levels and closed over the .382 level. Also after an extreme sell off price seems to have bottomed at 4.61. The ADX shows a relatively strong trend with the directional indicators moving in a bullish direction.
targeting:

STIM BullishMACD is crossing and the price has consolidated around $12.17 for several trading days. I will try to add between $12.17 and $11.60 with a stop at at $11.36
Target: $16.34

$STIM LONG - looks like price want to go higher$STIM - looks like it might be good here for a long position.
My stop is $16.50

See all ideas
Summarizing what the indicators are suggesting.
Neutral
SellBuy
Strong sellStrong buy
Strong sellSellNeutralBuyStrong buy
Neutral
SellBuy
Strong sellStrong buy
Strong sellSellNeutralBuyStrong buy
Neutral
SellBuy
Strong sellStrong buy
Strong sellSellNeutralBuyStrong buy
An aggregate view of professional's ratings.
Neutral
SellBuy
Strong sellStrong buy
Strong sellSellNeutralBuyStrong buy
Neutral
SellBuy
Strong sellStrong buy
Strong sellSellNeutralBuyStrong buy
Neutral
SellBuy
Strong sellStrong buy
Strong sellSellNeutralBuyStrong buy
Displays a symbol's price movements over previous years to identify recurring trends.
Frequently Asked Questions
The current price of STIM is 4.49 USD — it has increased by 0.90% in the past 24 hours. Watch Neuronetics, Inc. stock price performance more closely on the chart.
Depending on the exchange, the stock ticker may vary. For instance, on NASDAQ exchange Neuronetics, Inc. stocks are traded under the ticker STIM.
STIM stock has risen by 15.13% compared to the previous week, the month change is a 25.07% rise, over the last year Neuronetics, Inc. has showed a 138.83% increase.
We've gathered analysts' opinions on Neuronetics, Inc. future price: according to them, STIM price has a max estimate of 8.00 USD and a min estimate of 5.50 USD. Watch STIM chart and read a more detailed Neuronetics, Inc. stock forecast: see what analysts think of Neuronetics, Inc. and suggest that you do with its stocks.
STIM reached its all-time high on Sep 7, 2018 with the price of 39.39 USD, and its all-time low was 0.52 USD and was reached on Nov 12, 2024. View more price dynamics on STIM chart.
See other stocks reaching their highest and lowest prices.
See other stocks reaching their highest and lowest prices.
STIM stock is 3.54% volatile and has beta coefficient of 1.11. Track Neuronetics, Inc. stock price on the chart and check out the list of the most volatile stocks — is Neuronetics, Inc. there?
Today Neuronetics, Inc. has the market capitalization of 296.85 M, it has increased by 1.69% over the last week.
Yes, you can track Neuronetics, Inc. financials in yearly and quarterly reports right on TradingView.
Neuronetics, Inc. is going to release the next earnings report on Aug 5, 2025. Keep track of upcoming events with our Earnings Calendar.
STIM earnings for the last quarter are −0.21 USD per share, whereas the estimation was −0.12 USD resulting in a −69.63% surprise. The estimated earnings for the next quarter are −0.08 USD per share. See more details about Neuronetics, Inc. earnings.
Neuronetics, Inc. revenue for the last quarter amounts to 31.98 M USD, despite the estimated figure of 29.07 M USD. In the next quarter, revenue is expected to reach 36.78 M USD.
STIM net income for the last quarter is −12.68 M USD, while the quarter before that showed −12.16 M USD of net income which accounts for −4.25% change. Track more Neuronetics, Inc. financial stats to get the full picture.
No, STIM doesn't pay any dividends to its shareholders. But don't worry, we've prepared a list of high-dividend stocks for you.
As of Jul 26, 2025, the company has 716 employees. See our rating of the largest employees — is Neuronetics, Inc. on this list?
EBITDA measures a company's operating performance, its growth signifies an improvement in the efficiency of a company. Neuronetics, Inc. EBITDA is −35.78 M USD, and current EBITDA margin is −43.38%. See more stats in Neuronetics, Inc. financial statements.
Like other stocks, STIM shares are traded on stock exchanges, e.g. Nasdaq, Nyse, Euronext, and the easiest way to buy them is through an online stock broker. To do this, you need to open an account and follow a broker's procedures, then start trading. You can trade Neuronetics, Inc. stock right from TradingView charts — choose your broker and connect to your account.
Investing in stocks requires a comprehensive research: you should carefully study all the available data, e.g. company's financials, related news, and its technical analysis. So Neuronetics, Inc. technincal analysis shows the buy rating today, and its 1 week rating is strong buy. Since market conditions are prone to changes, it's worth looking a bit further into the future — according to the 1 month rating Neuronetics, Inc. stock shows the buy signal. See more of Neuronetics, Inc. technicals for a more comprehensive analysis.
If you're still not sure, try looking for inspiration in our curated watchlists.
If you're still not sure, try looking for inspiration in our curated watchlists.