NEAR Market OverviewAt the moment, we can see that the price is in an ABC correction. So far, it has only reached the 0.382 Fibonacci level and is currently sitting near the weekly pivot point at $2.58 . We're closely watching the price action here, as it's possible the price will extend to the 0.5 Fibonacci level at
Related pairs

NEAR 1H – Retest in Motion, But Will Bulls Hold 2.50?NEAR broke above its prior consolidation zone, retested it briefly, and surged higher toward the 2.63 area. Price is now pulling back, with the 2.50–2.52 support zone acting as the first key area for bulls to defend.
If the retest holds, the bullish path toward 2.70+ remains in play, following the

NEAR 4H – Squeezed Into Support, But Will the Bounce Stick? NEAR is being compressed between a major descending trendline and a historically strong demand zone on the 4H.
The setup is classic:
🔻 Lower highs = sustained bearish pressure
🔹 Flat support = buyer interest around $1.50–$2.00
🔄 Stoch RSI is flipping from oversold, hinting at possible relief
A cle

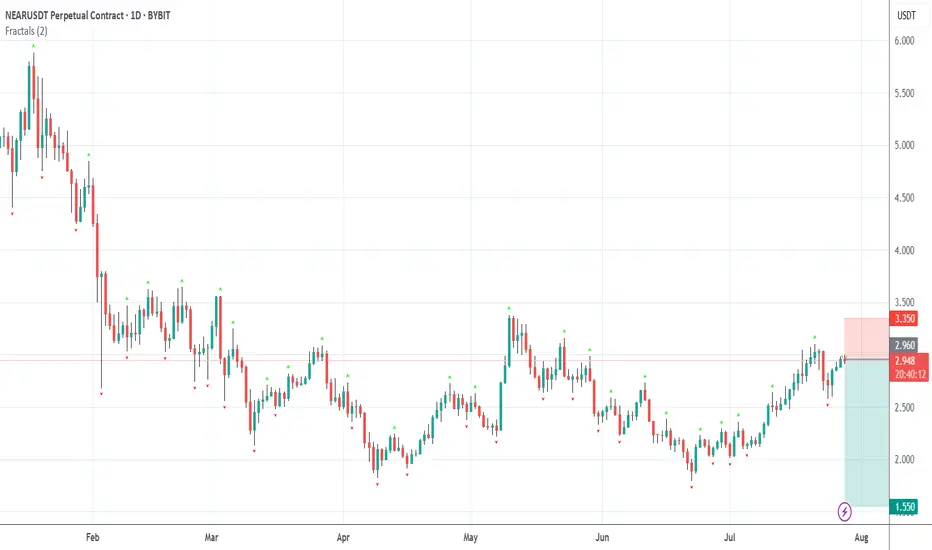
NEAR 4H Golden Pocket Bounce, Will Recovery Push Past 0.5 Fib?NEAR has rebounded strongly from the 0.618 Fib level within the golden pocket, reclaiming ground toward the 0.5 Fib near 2.46. A sustained breakout above this midpoint would strengthen bullish momentum and open the path toward 2.80+, while rejection here could send price back to retest the 2.31 zone

NEAR 8H – Higher Low Formed, But Can Bulls Target 3.10 Next?NEAR is showing signs of a long-term structural shift after bouncing cleanly from a major demand zone and printing a higher low above trendline support. The current 8H structure reflects a steady recovery with three clear upside targets already mapped from the most recent breakout sequence.
With th

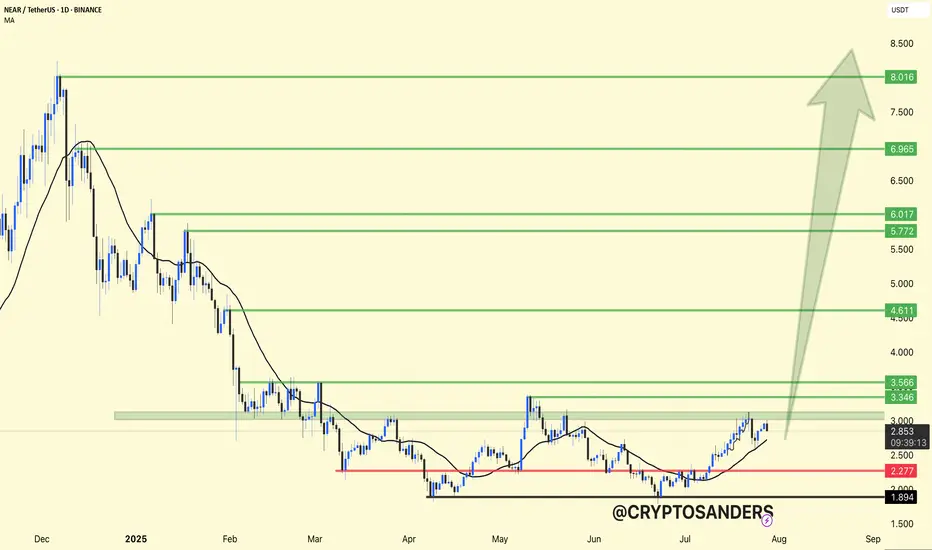
NEAR/USDT Daily Chart Update & Long Setup:NEAR has broken out of its accumulation zone and is now trading above the key support level of $2.27, with a clean higher-low structure forming.
Support Zone: $2.27
Immediate Resistance: $3.34 – $3.56
Breakout Confirmation Target: $4.61 → $5.77 → $6.96 → $8.01+
Long Trade Setup (Swing Idea):
Entry
Short on NEAR, but with caution!The technical setup is very clear and strong. The resistance level is well-defined. The fundamental news, while positive, is not reporting the kind of extreme, immediate buying pressure we saw with ENA. The news about developer activity is a long-term positive, but it doesn't invalidate a potential
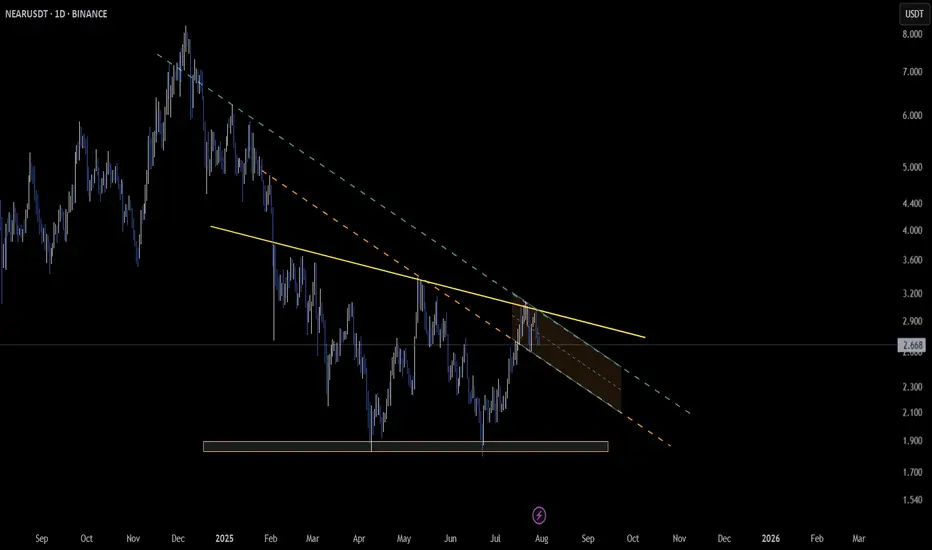
NEAR Approaching Key Breakout Zone – Structure TighteningCBOE:NEAR is showing mixed signals across timeframes 🧠
On the daily chart, price is moving within a descending triangle 📉 — often a bearish continuation setup.
However, from a different angle, it also appears to have broken above the trendline and retested it ✅ — suggesting early signs of a potent
NEAR 4H – Key Support Holding, But Will It Last?NEAR is approaching a key inflection point on the 4H timeframe. After breaking above the $2.68–2.70 range — a level that acted as major resistance throughout May and early June — price is now retesting it as support. This kind of structure flip is often seen at critical turning points in a trend, es

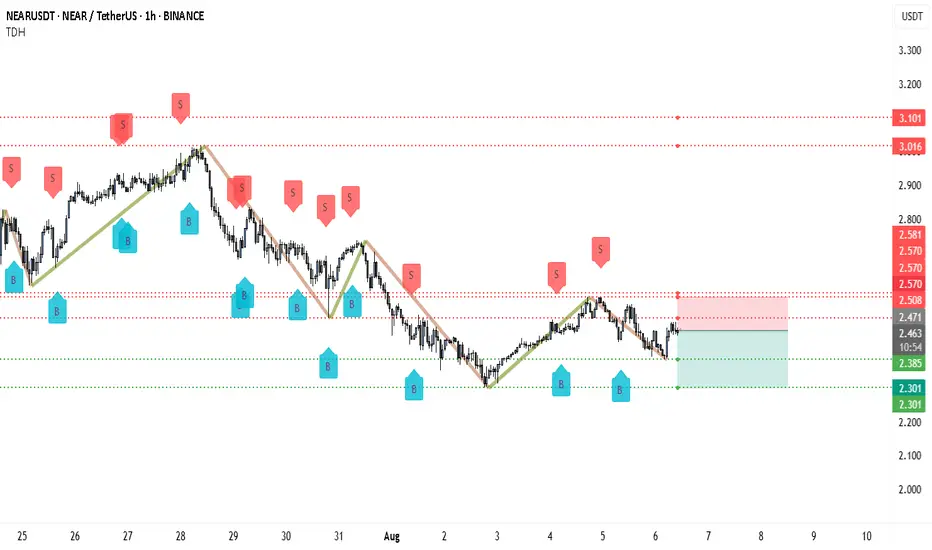
From $2.47 to $2.20 — Is NEAR Headed for a Sharp Selloff?NEAR is currently facing heavy selling pressure after failing to break above the $2.508–$2.570 resistance zone. This zone has acted as a strong supply area, with multiple “S” sell signals appearing here in recent sessions. The rejection from this level aligns with the broader downtrend structure tha
See all ideas
Summarizing what the indicators are suggesting.
Oscillators
Neutral
SellBuy
Strong sellStrong buy
Strong sellSellNeutralBuyStrong buy
Oscillators
Neutral
SellBuy
Strong sellStrong buy
Strong sellSellNeutralBuyStrong buy
Summary
Neutral
SellBuy
Strong sellStrong buy
Strong sellSellNeutralBuyStrong buy
Summary
Neutral
SellBuy
Strong sellStrong buy
Strong sellSellNeutralBuyStrong buy
Summary
Neutral
SellBuy
Strong sellStrong buy
Strong sellSellNeutralBuyStrong buy
Moving Averages
Neutral
SellBuy
Strong sellStrong buy
Strong sellSellNeutralBuyStrong buy
Moving Averages
Neutral
SellBuy
Strong sellStrong buy
Strong sellSellNeutralBuyStrong buy
Displays a symbol's price movements over previous years to identify recurring trends.
Curated watchlists where NEARUSDT is featured.

Gen 3 crypto: A new day dawns…
25 No. of Symbols

Smart contracts: Make the smart decision
36 No. of Symbols
See all sparks
Frequently Asked Questions
The current price of NEAR / TetherUS (NEAR) is 2.764 USDT — it has risen 3.39% in the past 24 hours. Try placing this info into the context by checking out what coins are also gaining and losing at the moment and seeing NEAR price chart.
NEAR / TetherUS price has risen by 16.11% over the last week, its month performance shows a 19.88% increase, and as for the last year, NEAR / TetherUS has decreased by −31.87%. See more dynamics on NEAR price chart.
Keep track of coins' changes with our Crypto Coins Heatmap.
Keep track of coins' changes with our Crypto Coins Heatmap.
NEAR / TetherUS (NEAR) reached its highest price on Jan 14, 2022 — it amounted to 20.597 USDT. Find more insights on the NEAR price chart.
See the list of crypto gainers and choose what best fits your strategy.
See the list of crypto gainers and choose what best fits your strategy.
NEAR / TetherUS (NEAR) reached the lowest price of 0.525 USDT on Nov 4, 2020. View more NEAR / TetherUS dynamics on the price chart.
See the list of crypto losers to find unexpected opportunities.
See the list of crypto losers to find unexpected opportunities.
The safest choice when buying NEAR is to go to a well-known crypto exchange. Some of the popular names are Binance, Coinbase, Kraken. But you'll have to find a reliable broker and create an account first. You can trade NEAR right from TradingView charts — just choose a broker and connect to your account.
Crypto markets are famous for their volatility, so one should study all the available stats before adding crypto assets to their portfolio. Very often it's technical analysis that comes in handy. We prepared technical ratings for NEAR / TetherUS (NEAR): today its technical analysis shows the buy signal, and according to the 1 week rating NEAR shows the neutral signal. And you'd better dig deeper and study 1 month rating too — it's sell. Find inspiration in NEAR / TetherUS trading ideas and keep track of what's moving crypto markets with our crypto news feed.
NEAR / TetherUS (NEAR) is just as reliable as any other crypto asset — this corner of the world market is highly volatile. Today, for instance, NEAR / TetherUS is estimated as 6.45% volatile. The only thing it means is that you must prepare and examine all available information before making a decision. And if you're not sure about NEAR / TetherUS, you can find more inspiration in our curated watchlists.
You can discuss NEAR / TetherUS (NEAR) with other users in our public chats, Minds or in the comments to Ideas.