TradeCityPro | NEAR Faces Resistance in Lower Range Zone👋 Welcome to TradeCity Pro!
In this analysis, I’m going to review NEAR, one of the AI and Layer1 crypto projects, currently ranked 35 on CoinMarketCap with a market cap of 2.77 billion dollars.
📅 Daily Timeframe
On the daily chart, NEAR has formed a large ranging box between the 1.884 and 3.548 levels and is currently positioned in the lower half of that range.
✔️ After hitting the lower boundary, the price has formed a trigger around the 2.279 level and is now fluctuating below it.
✨ A breakout above this level could give us a long entry. However, the downside is that volume is decreasing and diverging from price. If this volume drop continues, the likelihood of the range breaking to the downside increases.
📊 If volume starts to rise, considering that the RSI is stabilizing above the 50 zone, the probability of a bullish scenario becomes much stronger.
💥 The main resistance above the current price is at 3.548, which I’ve marked as a zone. In my opinion, breaking this level would be the main trigger for a spot buy, and I personally plan to wait for this level to break before buying spot.
🔔 If the price gets rejected from the 2.279 level and bearish momentum enters the market, a break below 1.884 would be a strong short trigger and could signal the start of a new bearish leg and continuation of the previous downtrend.
📝 Final Thoughts
This analysis reflects our opinions and is not financial advice.
Share your thoughts in the comments, and don’t forget to share this analysis with your friends! ❤️
NEARUSDT trade ideas

NEAR Protocol New All-Time High & Targets (PP: 1,108% Minimum)Here we have the same signal we just looked at in another publication, a break and close daily above EMA55 & EMA89. The bullish bias is confirmed.
The blue dotted line stands for EMA89 while the magenta one is EMA55. Once the action moves above daily, mid- to long-term growth is confirmed. Mid-term bullish above EMA55 and long-term bullish above EMA89. Near Protocol is bullish now.
NEARUSDT Technical analysis
On the main chart above we can see a peak March 2024 and a lower high in December of the same year. This means very strong, prolonged bearish action. After a strong bearish cycle comes a strong bullish cycle, the market tends to fluctuate, always fluctuating between bear and bull.
When the market is down, no need to worry because it will eventually grow.
When the market is up for a long while, watch out because a correction can develop anytime out of nowhere.
The cycles repeat over and over, again and again; forever, just like night and day. Winter, summer, spring and fall, the seasons. Everything in nature is cyclical, the market is no exception. We can use this information to our advantage, we know for certain that we are now entering a major growth phase because of the cyclical nature of the market.
The next high will be a major high compared to March 2024, and possibly a new all-time high compared to April 2022 which is the highest level on this chart. If you want to see bigger projections, go to my profile and search for NEARUSDT. You will find there everything you need.
NEAR Protocol new all-time high & targets
The first target is $12 for 368% profits potential. I don't count $5.77 because that is one of the easy targets. It is a shame to sell too early when prices are going really high-up. The $12 target would be the highest price in more than 3 years, since May 2022. This is the first higher high but not the end, the market is very likely to move higher, much higher.
The next target $18.6 for 615% profits potential. This is a good target to start. We then have $25 and $31 for a maximum of 1,108%. We should hit all of these targets within the next 6 months (6-8 months to be safe).
Patience is key. Buy and hold.
Thanks a lot for your continued support.
Namaste.

Near is preparing for an bullish move soonNear is preparing for an bullish move soon
The price broke out from a strong channel pattern.
Given that BTC is making a pause NEAR is possible to correct near to 2.37 before it moves up more as shown on the chart.
I am looking at for normal targets but it can make also a bigger movement as well.
Target areas: 2.78; 3.2 and 3.7
You may find more details in the chart!
Thank you and Good Luck!
PS: Please support with a like or comment if you find this analysis useful for your trading day

NEAR/USDT – Breakout in Progress? Watch This Zone CloselyNEAR is attempting to break out of a long-standing descending triangle. After a previous fakeout near the $2.70 zone, the price is again testing the upper trendline with strong momentum.
Chart Overview:
Price crossing the resistance of the descending structure.
Strong support held at $2.01 and $2.24 zones.
Volume is gradually increasing on breakout attempts.
RSI pushing higher, indicating building bullish momentum.
Trade Setup (on Break & Retest):
Entry: Wait for breakout and retest around $2.24–$2.28 zone
Stop Loss: Below $2.01
Targets:
Target 1: $2.44
Target 2: $2.70
Target 3: $2.97
Risk-Reward Estimate:
Approximately 2.5–3.5x RR depending on retest depth.
If NEAR reclaims $2.44 with conviction, this could trigger a sustained move toward $3+.
Watch BTC stability before entering.
DYOR | Not financial advice

NEAR BullWe got a abc correction, 5 waves down for the end of wave c exactly at the 382 fib. Target at 35 -70.

NearNear Protocol
NEAR Protocol is a blockchain platform designed for AI applications.
Everything is clear on the chart.
I wish everyone abundant profits.
Like and follow
for more.

NEAR Breakout Confirmed—But Is This Just a Bull Trap?Yello Paradisers! Did you see that breakout on #NEARUSDT? After weeks of consistent lower highs and a clearly defined descending resistance, price action has finally snapped that bearish structure and completed a textbook inverse Head and Shoulders formation on the 12H chart. This kind of pattern doesn’t appear often at key cycle points, and when it does—especially with confirmation—it becomes a high-probability signal of a trend reversal.
💎#NEARUSDT ,The neckline of the inverse H&S, sitting around the $2.17–$2.23 zone, has now been broken and crucially retested as support. This means the former resistance is now acting as a probable base for bulls, and if price remains above this area, the market is likely preparing for a strong probable impulsive move to the upside.
💎The structure shows clear bullish intent, and from a technical perspective, the first resistance comes in at $2.72. A clean break above that could open the door toward the major resistance zone between $2.97 and $3.05, which would complete the projected breakout target of the H&S pattern.
💎If bulls manage to maintain control above the $2.17–$2.23 support zone, we expect price to slowly build momentum toward $2.72, with increased volatility likely once that level is tested. Should that break occur with volume, the next leg may extend rapidly into the major resistance zone. However, if price fails to hold above this flipped support zone, we will be closely watching the $2.02–$1.89 area as the last major support before invalidation.
💎A daily candle closing below $1.798 would invalidate this entire bullish thesis and put the market back into a neutral-to-bearish range.
💎Adding more probability to this setup, NEAR is now trading above multi-timeframe EMA on higher time frame. This multi-timeframe EMA alignment supports bullish continuation, as momentum begins to shift in favor of buyers. However, continuation depends heavily on how price reacts at each resistance level—especially as we enter the mid-$2.70s.
💎The probable move from here is bullish, with the expectation that NEAR pushes toward the $2.72 level in the short term, followed by a potential rally to $2.97–$3.05 if momentum sustains. This scenario remains valid as long as price holds above $2.17, and especially above $2.02. Below that, the structure weakens. Below $1.798, the bullish bias becomes fully invalidated.
This is the only way you will make it far in your crypto trading journey. Stay sharp and patient, Paradisers. It’s not about chasing pumps—it’s about positioning smartly before the crowd.
MyCryptoParadise
iFeel the success🌴

NEAR Protocol Analysis: Riding the Uptrend to Key ResistanceThis 1-hour chart for NEAR Protocol (NEAR/USDT) shows a healthy and structured uptrend. The drawn levels outline a clear trading plan based on current momentum and key price zones.
Asset: NEAR Protocol / TetherUS (NEAR/USDT)
Timeframe: 1-Hour (Short-to-medium term outlook)
Overall Trend: The asset is in a clear uptrend, consistently setting higher highs and higher lows, which is a bullish sign.
Key Levels and Indicators
Support Levels (Potential Buy Zones):
Ascending Trendline (Red Line): This diagonal line acts as the backbone of the current rally. The price has respected this line as dynamic support multiple times. As long as the price remains above this trendline, the bullish structure is considered intact.
Demand Zone (Green Box): The area between approximately $2.57 and $2.61 is marked as a key horizontal support or "demand" zone. On any pullback, this is the first area where buyers are likely to show interest.
Resistance Levels (Potential Sell/Target Zones):
Immediate Resistance (~$2.70): The recent peak around $2.70 acts as the first minor hurdle. The price needs to break and hold above this level to continue its ascent.
Primary Target (Red Box): The box labeled "resistance" around $2.80 is the main target for this bullish move. This is a significant level where traders might look to take profits, and selling pressure could increase.
Potential Strategy
The overall strategy shown on the chart is bullish. The plan is to trade with the prevailing uptrend.
A trader might look to enter a long (buy) position on a price dip into one of the support areas:
A pullback into the green demand box (~$2.57 - $2.61).
A bounce off the red ascending trendline.
The ultimate goal for this trade would be the primary resistance target at $2.80. A break and close below the red ascending trendline would likely invalidate the immediate bullish thesis.

NEAR/USDT – Monthly Breakout in ProgressNEAR Protocol has just broken above the Monthly L1 resistance at $2.361, signaling a possible long-term bullish reversal. With strong price momentum, eyes are now set on the next major levels ahead.
🔍 Technical Breakdown:
Monthly L1 at $2.361 has been decisively broken with volume.
Clean structure forming higher lows since local bottom.
Bullish structure emerging on higher timeframes.
🎯 Upside Targets:
Target 1 – Monthly L2: $5.9868 (mid-term resistance zone)
Target 2 – Monthly L3: $10.30 (macro resistance, historical supply zone)
🛡️ Key Support Zones:
Retest of $2.36 could offer a high-R/R entry if bullish momentum holds.
Maintain bullish bias above $2.00 – invalidation below this level on high timeframes.
📈 Momentum picking up — if volume sustains and BTC remains steady, NEAR could be setting up for a larger trend continuation.

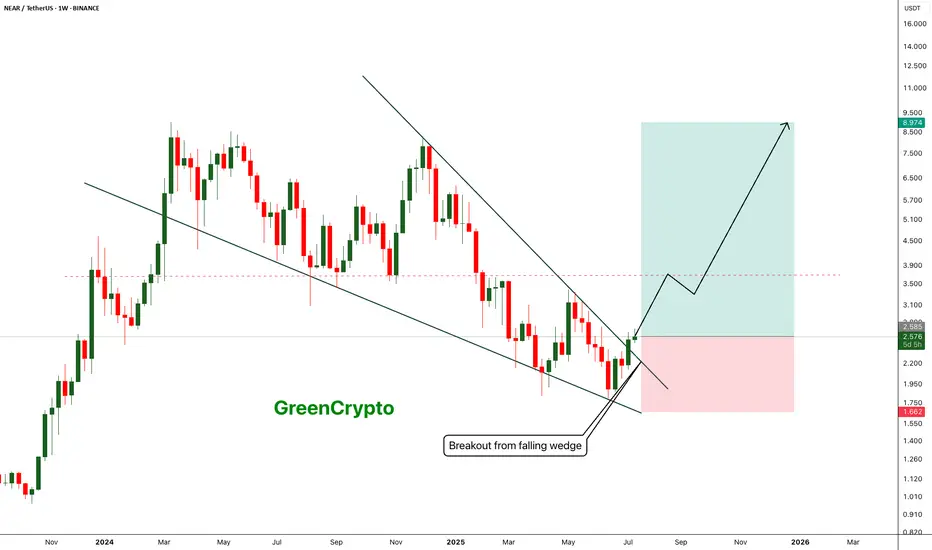
NEAR - Breakout from falling wedge pattern- Near has successfully broken out from the falling wedge pattern and now heading towards the next minor resistance around 3.6 range
- breakout from the minor resistance should push price towards the 9$ range
Entry Price: 2.57
Stop Loss: 1.66
TP1:2.935
TP2: 3.256
TP3: 3.986
TP4: 5.461
TP5: 7.102
TP6: 8.948
Stay tuned for more updates.
Cheers
GreenCrypto
#NEAR Update #1 – July 10, 2025🔴 #NEAR Update #1 – July 10, 2025
Near started a new impulsive move after the previous one, but this move isn’t significantly higher. It’s almost at the same level. Therefore, unless this impulsive move reaches the $2.45 zone, we cannot consider it strong.
If NEAR rises to the $2.45 zone, we can call it a strong impulsive move. But if it fails to do so, I expect a pullback of around 5–6%. There is also an imbalance supporting this retracement.
If the price fails to reach the $2.45 zone, there is a likelihood of a pullback towards the $2.22 zone. This is not a long or short recommendation.
NEAR Breaks Downtrend – Bullish Momentum Targets $2.72 & $3.33NEAR/USDT just completed a clean Break of Structure (BOS) from a long-running descending channel — a move that could shift momentum and open up upside toward previous highs.
📊 Technical Highlights:
🔹 Double Rejection at Support: Price found strong demand at ~$1.80–$1.90, bouncing twice from the same level.
🔹 Breakout from Descending Channel: The downtrend has officially snapped — bulls are stepping in.
🔹 BOS Confirmed: Structure is shifting bullish after months of lower highs.
🔹 Primary Target: $2.72 — previous mid-range consolidation
🔹 Secondary Target: $3.33 — full measured move back toward prior highs
🔹 Stoch RSI: Currently maxed out — short-term pullback could offer re-entry

near chart analysisbreif discuss the chart of near upcoming potential might be pump from here heavliy

$NEAR Disappointing so far...CBOE:NEAR is disappointing me as it continues towards the lows
Testing the .786 alt-coin golden pocket High Volume Node so should see a decent reaction from here as it appears a an ABC correction is complete after an Elliot wave motif wave.
Safe trading

NEAR | Trade Setup📌 After the reaction from the bearish target zones (blue), we've now activated a bullish sequence (yellow) in $Near.
📊 Valid entries are currently forming during a potential B-C correction.
Trademanagement:
I'm placing long orders at each level.
Once the trade reaches a 2 R/R, I’ll move the stop-loss to break-even.
From a 3 R/R onward, I’ll start locking in profits.
Once I’ve locked in my first profits, I’ll share the next profit targets with you.
NEARUSDT 1D#NEAR is trading inside a descending channel on the daily chart and has recently bounced off a strong support zone.
It’s now on the verge of breaking above the channel resistance.
If a breakout occurs, the next targets are:
🎯 $2.453
🎯 $2.625
🎯 $2.796
🎯 $3.040
🎯 $3.351
⚠️ As always, use a tight stop-loss and follow proper risk management.

$NEAR Approaching Breakout from 54D Trendline!CBOE:NEAR
In the LTF, CBOE:NEAR is sitting at the 0.5 Fib retracement level.
Which is a pretty good level to buy.
We have a 54D long descending trendline resistance, which we need to break out of.
IMO, we will break this trendline soon, so keep an eye on it.
We have strong support at the $1.884 level, accumulate above this level.
DYOR, NFA
#NEARProtocol
#NEAR Update #2 – July 15, 2025#NEAR Update #2 – July 15, 2025
As seen on the chart, these are the positions I previously opened on NEAR. I didn’t use any stop-loss. Instead, I added to my position when the price dipped slightly, which allowed me to lower my average entry price.
Currently, the targets are clearly defined on the chart. I still do not plan to use any stop-loss, as I have available balance to add further in case of a drop. Those interested in evaluating this setup may consider doing the same.
NEAR has completed the correction phase of both its first and second impulsive moves. Based on this, the current target stands around the $2.78 level.

NEARUS 8H – Testing Key Resistance Inside Falling Channel🔍 Chart Overview:
NEAR has been trading inside a well-defined falling channel since mid-May. Price has consistently respected both the upper and lower trendlines, confirming this as a dominant structure.
🔵 Key Zones:
Support Zone (~$1.85–$1.95): Multiple bounce reactions (R1 in April & R2 in June) confirm this zone as a strong demand area.
Current Price Action: Price recently bounced off support and is now pressing against the upper channel boundary (~$2.25). A breakout here could be the first bullish signal in months.
📌 Indicators:
Stoch RSI: Curling upward, currently at 57.18 – suggesting bullish momentum is building.
Volume: Slight uptick in volume on the latest push – worth watching for confirmation.
🧠 Strategy Notes:
Bullish Scenario: Break and close above the descending resistance could lead to a run toward $2.60–$2.90 range.
Bearish Scenario: Rejection here would keep the downtrend intact, with price likely retesting the support zone again.
🛠️ Pattern in Play:
Descending Channel
Double Bottom Potential @ Support Zone

NEARUSDT Breakout Watch Descending Triangle Reversal in Progress🧠 Pattern and Structure Analysis
The NEAR/USDT pair is currently displaying a long-term Descending Triangle pattern that has been developing for over 6 months. While descending triangles are typically bearish continuation patterns, a breakout to the upside often signals a strong trend reversal.
Descending resistance trendline: Multiple touchpoints confirming the structure.
Horizontal support zone: Strong base formed between $1.79 – $2.21.
The current price action shows a potential breakout above the descending resistance, indicating a possible shift in trend.
🚀 Bullish Scenario
If the breakout is confirmed (especially with high volume and daily close above the trendline), NEAR could rally toward the following resistance levels:
1. Target 1: $2.693 – minor resistance
2. Target 2: $3.021 – key psychological and technical level
3. Target 3: $3.568 – previous support/resistance flip
4. Target 4: $4.635 – major resistance zone
5. Extended Targets: $6.028 and $8.062 – historical highs
📌 Breakout confirmation requires a daily close above $2.25 with increased volume.
🐻 Bearish Scenario
If the breakout fails and the price gets rejected at the trendline:
Price may revisit the strong support zone around $1.79.
A breakdown below this support would open the door to deeper downside levels, possibly below $1.70 or even toward $1.50.
The bearish outlook would be invalidated if the price sustains above $2.30 and forms a higher-high structure.
🔍 Strategic Summary
Pattern: Descending Triangle (Potential Reversal)
Breakout Level: ~$2.25
Key Support: $1.79 – $2.21
Recommendation: Watch for a confirmed breakout with strong volume. Use a trailing stop strategy to lock in profits as targets are reached.
#NEAR #NEARUSDT #CryptoBreakout #AltcoinSeason #DescendingTriangle #TechnicalAnalysis #CryptoTrading #BullishSetup #ReversalPattern #ChartPattern

NEARUSDT 1D AnalysisNEAR ~ 1D Analysis
#NEAR Buy back on retest of this support block with short term target of at least 15%+ from here.

YOLO Near USDT is a stellar buy here HUGE UPSIDELast cycle we saw a large correction to these levels before seeing a huge altcoin season. I believe we will see another run this cycle.
Near is a entry between $1.90 and 1.60.
Sell targets 8 20% sell
$12 20% sell
$16 20% sell
$20 20% sell
20% sell: Let it rideeeee to euphoria

Descending Channel Breakout Ahead for $NEARUSDTCBOE:NEAR is trading in a descending channel on the 6H chart.
After bouncing from $2.140 support, it’s showing signs of a short-term recovery, with a target of $2.50, 13.40%.
MACD crossover supports bullish momentum.
Holding support is key, or the downtrend continues.
DYRO, NFA
