APAR Industries Trading IdeaNSE:APARINDS is on the Move and we can have an Immediate Target for 8450. On the Risk Reward Part, we can Target for 10,200, if Market conditions are good, with Trailing stoploss.
Next report date
—
Report period
—
EPS estimate
—
Revenue estimate
—
204.45 INR
8.21 B INR
185.81 B INR
15.79 M
About APAR INDUSTRIES LTD.
Sector
Industry
Website
Headquarters
Mumbai
Founded
1958
ISIN
INE372A01015
FIGI
BBG000L6NZ45
APAR Industries Ltd. engages in the business of manufacture and sale of conductors, specialty oils, and cables. It operates through the following segments: Conductor, Transformer and Specialties Oils, Power/Telecom Cables, and Others. The company was founded by Dharmsinh D. Desai in 1958 and is headquartered in Mumbai, India.
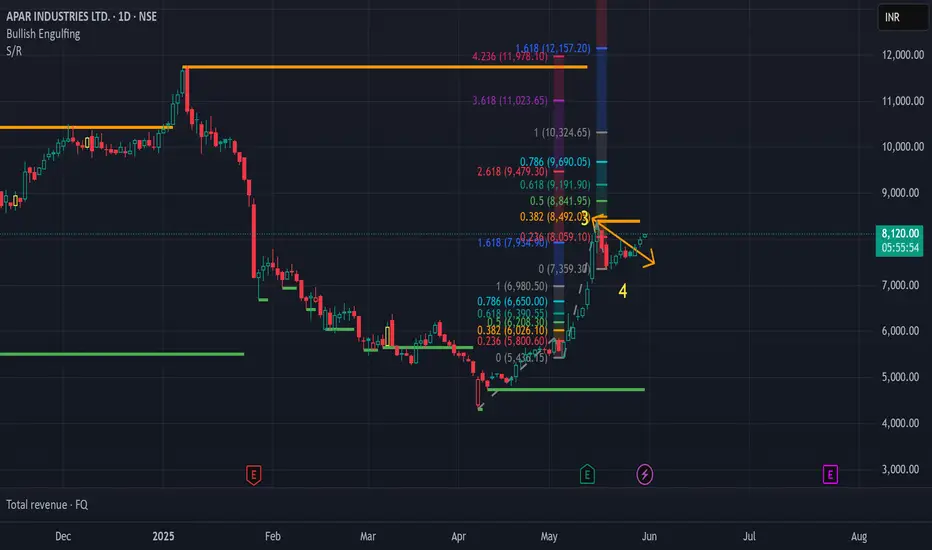
APAR Ignites: Breakout Above 200 EMA Signals Bullish Surge📘 Technical Analysis Report
Stock: APAR Industries Ltd. (NSE)
Chart Type: Daily Candlestick Chart
Date: May 15, 2025
📊 Price Action
Current Price: ₹7,941.00
Daily Change: +₹1,013.50 (+14.63%)
Strong bullish candlestick observed with significant upward momentum.
V-shaped recovery from recent lows n

APAR INDUSTRIES LTD S/R Support and Resistance Levels:
Support Levels: These are price points (green line/shade) where a downward trend may be halted due to a concentration of buying interest. Imagine them as a safety net where buyers step in, preventing further decline.
Resistance Levels: Conversely, resistance levels (re

Apar Industries: Detailed Long Positional Trade Idea Apar Industries: Detailed Long Positional Trade Idea 🚀
Technical Setup: A classic Inverse Head and Shoulders breakout on the daily chart, indicating a strong bullish reversal. The breakout is supported by rising volumes, confirming buying interest.
Entry Point: Enter above ₹10,950 for a confirmed

Quick APARINDS (APAR INDUSTRIES) long tradeJust for fun and in case anyone who follows me is from India, I thought I'd take a crack at a Nifty stock.
NSE:APARINDS is oversold at the bottom of an upward channel going back to the beginning of the year. Since then, my algo entry along with my FPC exit strategy would be 17-0. Given its uptre

Apar Industries - Cup and HandleApar Industries - Cup and Handle is confirmed on the daily basis. The cup is formed, no overhead. trending --30% up , cup formed 15% down. RS Positive. Above 21 and 50 DMA

APAR INDUSTRIES LTD S/R Support and Resistance Levels:
Support Levels: These are price points (green line/shade) where a downward trend may be halted due to a concentration of buying interest. Imagine them as a safety net where buyers step in, preventing further decline.
Resistance Levels: Conversely, resistance levels (re

Apar industries swingFlag pattern breakout
This type of flag b.o yield is high
Company is good as well as delivered good results
Short term gains and stock is good to hold for long term also.
Levels are marked according to fib levels.


APARINDSStock name = Apar Industries Limited.
Weekly chart setup
Chart is self explanatory. Levels of breakout, possible up-moves (where stock may find resistances) and support (close below which, setup will be invalidated) are clearly defined.
Master Score - B
Disclaimer: This is for demonstration and ed

See all ideas
Summarizing what the indicators are suggesting.
Neutral
SellBuy
Strong sellStrong buy
Strong sellSellNeutralBuyStrong buy
Neutral
SellBuy
Strong sellStrong buy
Strong sellSellNeutralBuyStrong buy
Neutral
SellBuy
Strong sellStrong buy
Strong sellSellNeutralBuyStrong buy
An aggregate view of professional's ratings.
Neutral
SellBuy
Strong sellStrong buy
Strong sellSellNeutralBuyStrong buy
Neutral
SellBuy
Strong sellStrong buy
Strong sellSellNeutralBuyStrong buy
Neutral
SellBuy
Strong sellStrong buy
Strong sellSellNeutralBuyStrong buy
Displays a symbol's price movements over previous years to identify recurring trends.
Related stocks
Frequently Asked Questions
The current price of APARINDS is 7,841.00 INR — it has decreased by −0.15% in the past 24 hours. Watch APAR INDUSTRIES LTD. stock price performance more closely on the chart.
Depending on the exchange, the stock ticker may vary. For instance, on NSE exchange APAR INDUSTRIES LTD. stocks are traded under the ticker APARINDS.
APARINDS stock has fallen by −2.31% compared to the previous week, the month change is a −2.81% fall, over the last year APAR INDUSTRIES LTD. has showed a −7.65% decrease.
We've gathered analysts' opinions on APAR INDUSTRIES LTD. future price: according to them, APARINDS price has a max estimate of 10,500.00 INR and a min estimate of 7,165.00 INR. Watch APARINDS chart and read a more detailed APAR INDUSTRIES LTD. stock forecast: see what analysts think of APAR INDUSTRIES LTD. and suggest that you do with its stocks.
APARINDS reached its all-time high on Jan 8, 2025 with the price of 11,779.90 INR, and its all-time low was 33.10 INR and was reached on Jul 13, 2004. View more price dynamics on APARINDS chart.
See other stocks reaching their highest and lowest prices.
See other stocks reaching their highest and lowest prices.
APARINDS stock is 1.77% volatile and has beta coefficient of 1.60. Track APAR INDUSTRIES LTD. stock price on the chart and check out the list of the most volatile stocks — is APAR INDUSTRIES LTD. there?
Today APAR INDUSTRIES LTD. has the market capitalization of 320.64 B, it has increased by 3.19% over the last week.
Yes, you can track APAR INDUSTRIES LTD. financials in yearly and quarterly reports right on TradingView.
APAR INDUSTRIES LTD. is going to release the next earnings report on Jul 24, 2025. Keep track of upcoming events with our Earnings Calendar.
APARINDS net income for the last quarter is 2.50 B INR, while the quarter before that showed 1.75 B INR of net income which accounts for 42.91% change. Track more APAR INDUSTRIES LTD. financial stats to get the full picture.
Yes, APARINDS dividends are paid annually. The last dividend per share was 51.00 INR. As of today, Dividend Yield (TTM)% is 0.64%. Tracking APAR INDUSTRIES LTD. dividends might help you take more informed decisions.
EBITDA measures a company's operating performance, its growth signifies an improvement in the efficiency of a company. APAR INDUSTRIES LTD. EBITDA is 15.46 B INR, and current EBITDA margin is 8.33%. See more stats in APAR INDUSTRIES LTD. financial statements.
Like other stocks, APARINDS shares are traded on stock exchanges, e.g. Nasdaq, Nyse, Euronext, and the easiest way to buy them is through an online stock broker. To do this, you need to open an account and follow a broker's procedures, then start trading. You can trade APAR INDUSTRIES LTD. stock right from TradingView charts — choose your broker and connect to your account.
Investing in stocks requires a comprehensive research: you should carefully study all the available data, e.g. company's financials, related news, and its technical analysis. So APAR INDUSTRIES LTD. technincal analysis shows the neutral today, and its 1 week rating is buy. Since market conditions are prone to changes, it's worth looking a bit further into the future — according to the 1 month rating APAR INDUSTRIES LTD. stock shows the buy signal. See more of APAR INDUSTRIES LTD. technicals for a more comprehensive analysis.
If you're still not sure, try looking for inspiration in our curated watchlists.
If you're still not sure, try looking for inspiration in our curated watchlists.