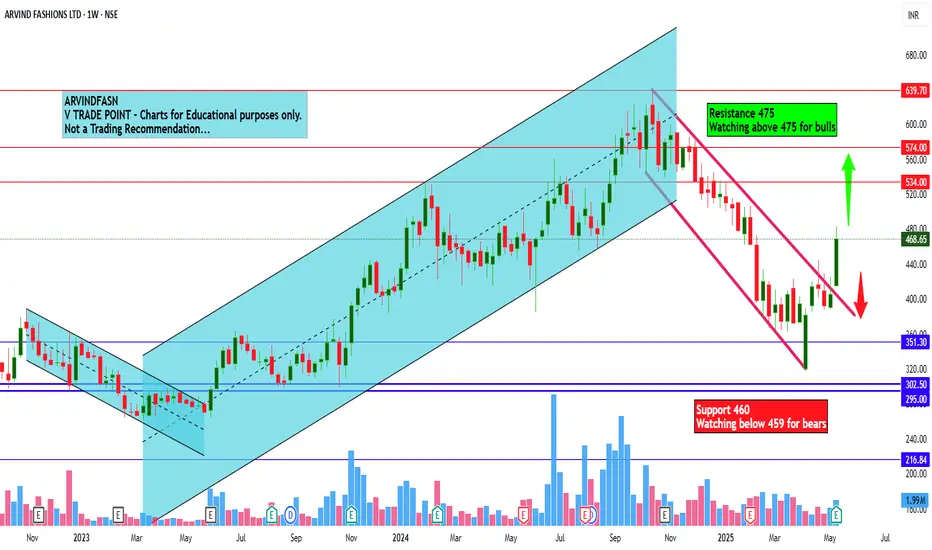
Arvind Fashions Ltd view for Intraday 19th May #ARVINDFASN Arvind Fashions Ltd view for Intraday 19th May #ARVINDFASN
Resistance 475 Watching above 475 for upside momentum.
Support area 460 Below 465 ignoring upside momentum for intraday
Watching below 459 for downside movement...
Above 465 ignoring downside move for intraday
Charts for Educational purp
Next report date
—
Report period
—
EPS estimate
—
Revenue estimate
—
−2.65 INR
−355.70 M INR
46.20 B INR
81.24 M
About ARVIND FASHIONS LTD
Sector
Industry
CEO
Shailesh Shyam Chaturvedi
Website
Headquarters
Ahmedabad
Founded
1931
ISIN
INE955V01021
FIGI
BBG00J5MQVB5
Arvind Fashions Ltd. engages in the distribution and sale of ready-made garments, apparel, and accessories. Its brand portfolio consists of owned and licensed international brands including U.S. Polo, Arrow, Tommy Hilfiger, Flying Machine, Aeropostale, GAP, Calvin Klein, GANT, Nautica, Unlimited, Sephora, Hanes, and others. The company was founded in 1931 and is headquartered in Ahmedabad, India.
Related stocks
ARVINDFASN : Ready to Ride Wave 5 to New Highs
Price Action Overview:
Current price: ₹532.15 , trading within the Wave 4 completion zone ( ₹526–₹570 ) as per Elliott Wave analysis.
A deep retracement zone is identified between ₹495–₹505 , aligning with Wave C completion, where a bullish reversal is expected.
Wave C indicates a strong poten

SWING IDEA - ARVINDFASNPrice has retested successfully at long time gap zone and has bounced multiple times at same point.
Stock is also making a parabolic formation since start of 2024.
Also near 52W High.
Also the following could take the stock to new highs in the coming weeks.
Q4 CONS NET PROFIT 243M RUPEES VS 109M (

Looking very strong for shrot termStock is strong in bigger timeframes and small Timeframe is showing a support.
which indicate stock can achieve a good return in short term.
Todays price: 608
Stoploss: 566
Target: 802
Good risk reward
Disclaimer: This idea is for personal learning and no buy or sell recommendation.

Darvas Box Strategy - Breakout StockDisclaimer: I am Not SEBI Registered adviser, please take advise from your financial adviser before investing in any stocks. Idea here shared is for education purpose only.
Stock has given break out. Keep this stock in watch list.
Buy above the High and do not forget to keep stop loss best suitable

ARVNDFASN Showing reversal signals from Support.Aravind Fashion, the stock was ranging around its ipo price after breakout. Now the stock is retesting the levels and at a small trend line support. Expecting a reversal from bottom.

Buy Arvindfasn above 338 Target 425/480/540 avg@260 sl below 22The stock is making the cup & handle pattern with a bullish outlook and volume. Also fundamentally the company is reducing debt and currently the demand for apparels can see a surge with increased prices due to commodity cycle and energy crisis through upcoming winter season. Overall the stock is bu

Ramp Walk REMO stealing the show - Arvind FashionsArvind Fashions is doing Bold Ramp Walk :)
On Weekly - we see Double Bottom Pattern, Followed by Flag Pole - All Breakouts powerful and successful and heading to defined targets steadily
Target 1 - 517 (Reached)
Target 2 - 531
Target 3 - 640
Target 4 - 700
Target 5 - 780
As part of the Budget t

ARVINDFASNARVINDFASN
weekly timeframe
i just shared my experience it is not an invite or recommendation to trade.
if youn any doubt means Please leave comments for any query.
best wishes
DYSON

Arvind Fashion has been given a strong breakoutArvind Fashion has been given a strong breakout on daily chart
Company has delivered good profit growth of 59.9% CAGR over last 5 years
FII's Are Increasing their stake.

See all ideas
Summarizing what the indicators are suggesting.
Neutral
SellBuy
Strong sellStrong buy
Strong sellSellNeutralBuyStrong buy
Neutral
SellBuy
Strong sellStrong buy
Strong sellSellNeutralBuyStrong buy
Neutral
SellBuy
Strong sellStrong buy
Strong sellSellNeutralBuyStrong buy
An aggregate view of professional's ratings.
Neutral
SellBuy
Strong sellStrong buy
Strong sellSellNeutralBuyStrong buy
Neutral
SellBuy
Strong sellStrong buy
Strong sellSellNeutralBuyStrong buy
Neutral
SellBuy
Strong sellStrong buy
Strong sellSellNeutralBuyStrong buy
Displays a symbol's price movements over previous years to identify recurring trends.
Frequently Asked Questions
The current price of ARVINDFASN is 490.80 INR — it has increased by 2.80% in the past 24 hours. Watch ARVIND FASHIONS LTD stock price performance more closely on the chart.
Depending on the exchange, the stock ticker may vary. For instance, on NSE exchange ARVIND FASHIONS LTD stocks are traded under the ticker ARVINDFASN.
ARVINDFASN stock has risen by 5.50% compared to the previous week, the month change is a 5.21% rise, over the last year ARVIND FASHIONS LTD has showed a −0.18% decrease.
We've gathered analysts' opinions on ARVIND FASHIONS LTD future price: according to them, ARVINDFASN price has a max estimate of 687.00 INR and a min estimate of 570.00 INR. Watch ARVINDFASN chart and read a more detailed ARVIND FASHIONS LTD stock forecast: see what analysts think of ARVIND FASHIONS LTD and suggest that you do with its stocks.
ARVINDFASN reached its all-time high on Mar 26, 2019 with the price of 810.20 INR, and its all-time low was 107.40 INR and was reached on May 20, 2020. View more price dynamics on ARVINDFASN chart.
See other stocks reaching their highest and lowest prices.
See other stocks reaching their highest and lowest prices.
ARVINDFASN stock is 4.77% volatile and has beta coefficient of 1.25. Track ARVIND FASHIONS LTD stock price on the chart and check out the list of the most volatile stocks — is ARVIND FASHIONS LTD there?
Today ARVIND FASHIONS LTD has the market capitalization of 65.48 B, it has decreased by −0.25% over the last week.
Yes, you can track ARVIND FASHIONS LTD financials in yearly and quarterly reports right on TradingView.
ARVIND FASHIONS LTD is going to release the next earnings report on Aug 7, 2025. Keep track of upcoming events with our Earnings Calendar.
ARVINDFASN net income for the last quarter is −931.50 M INR, while the quarter before that showed 266.60 M INR of net income which accounts for −449.40% change. Track more ARVIND FASHIONS LTD financial stats to get the full picture.
Yes, ARVINDFASN dividends are paid annually. The last dividend per share was 1.25 INR. As of today, Dividend Yield (TTM)% is 0.25%. Tracking ARVIND FASHIONS LTD dividends might help you take more informed decisions.
EBITDA measures a company's operating performance, its growth signifies an improvement in the efficiency of a company. ARVIND FASHIONS LTD EBITDA is 6.02 B INR, and current EBITDA margin is 13.03%. See more stats in ARVIND FASHIONS LTD financial statements.
Like other stocks, ARVINDFASN shares are traded on stock exchanges, e.g. Nasdaq, Nyse, Euronext, and the easiest way to buy them is through an online stock broker. To do this, you need to open an account and follow a broker's procedures, then start trading. You can trade ARVIND FASHIONS LTD stock right from TradingView charts — choose your broker and connect to your account.
Investing in stocks requires a comprehensive research: you should carefully study all the available data, e.g. company's financials, related news, and its technical analysis. So ARVIND FASHIONS LTD technincal analysis shows the strong buy rating today, and its 1 week rating is strong buy. Since market conditions are prone to changes, it's worth looking a bit further into the future — according to the 1 month rating ARVIND FASHIONS LTD stock shows the buy signal. See more of ARVIND FASHIONS LTD technicals for a more comprehensive analysis.
If you're still not sure, try looking for inspiration in our curated watchlists.
If you're still not sure, try looking for inspiration in our curated watchlists.